A few major cryptocurrencies are in an uptrend and they could offer buying opportunities in the short-term.
For some reason, Bitcoin (BTC) analysts never take the middle path. They either project that the price will go to the moon or warn of imminent doom. After surviving and thriving for over a decade and being one of the best assets to own during the current crisis, any doubts about its longevity should be put to rest.
On the other hand, for the top-ranked cryptocurrency on CoinMarketCap to replicate the previous bull run, it would first need to break out to new lifetime highs. There are several intermittent resistances between the current levels and the lifetime highs that need to be crossed first. Barring a miracle, this is likely to take time. The time spent in a bottoming formation will strengthen the base and act as a launchpad for the next bull run.
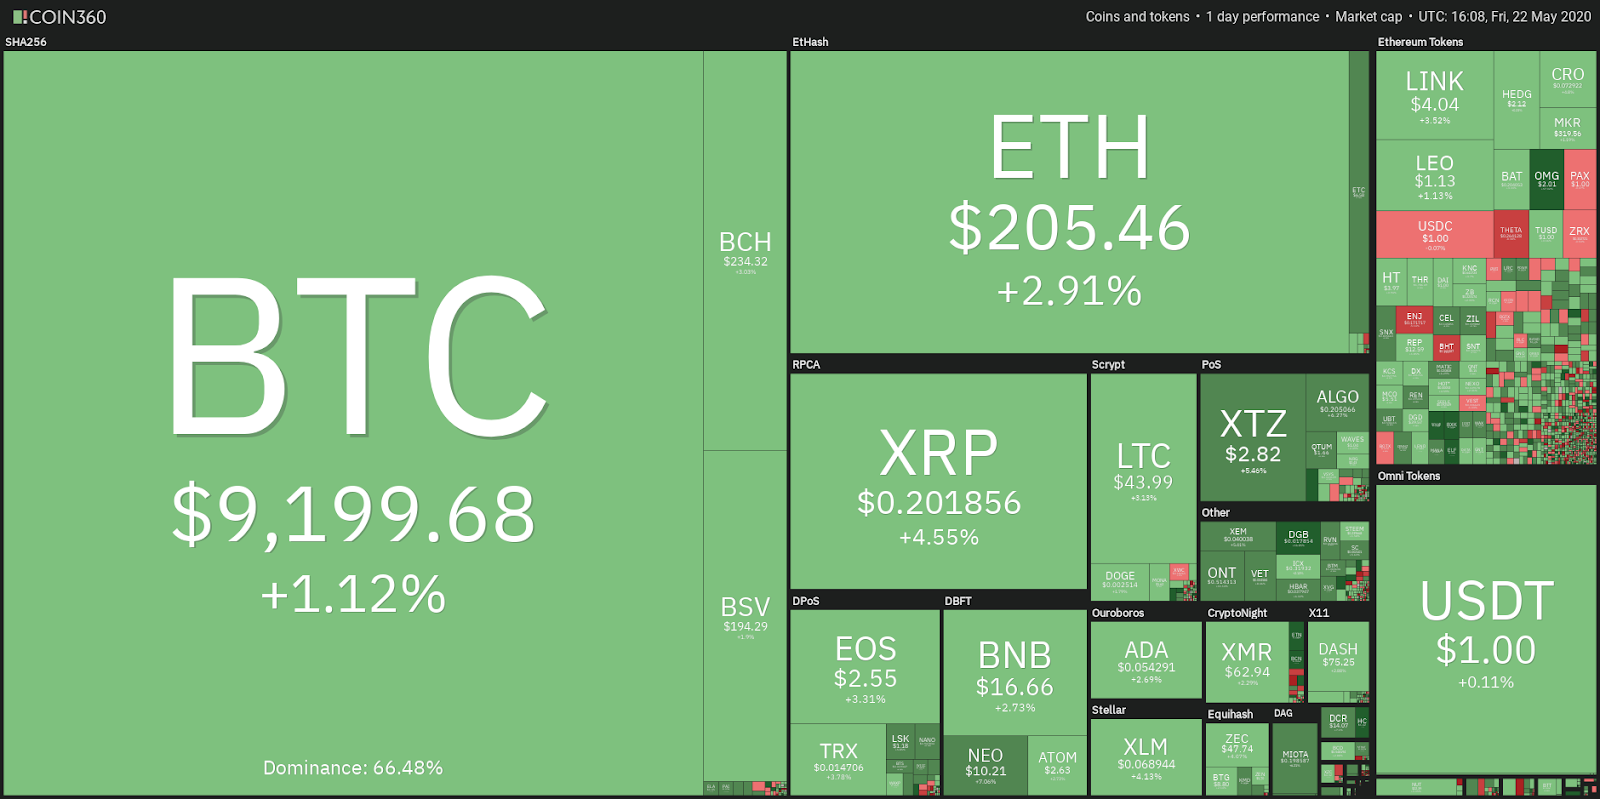
Daily cryptocurrency market performance. Source: Coin360
The investors who have purchased for the long-term should not be disturbed with small price swings. However, traders, who aim to profit from the volatility in the crypto sector should be willing to book profits at stiff resistances and buy at strong supports. They should gradually aim to build their portfolio instead of waiting for a home run on every trade.
Although cryptocurrencies are volatile, if traded with proper risk management, they offer an attractive opportunity to generate wealth. Let’s study the charts of the major cryptocurrencies to see if we spot any reliable trade setups.
BTC/USD
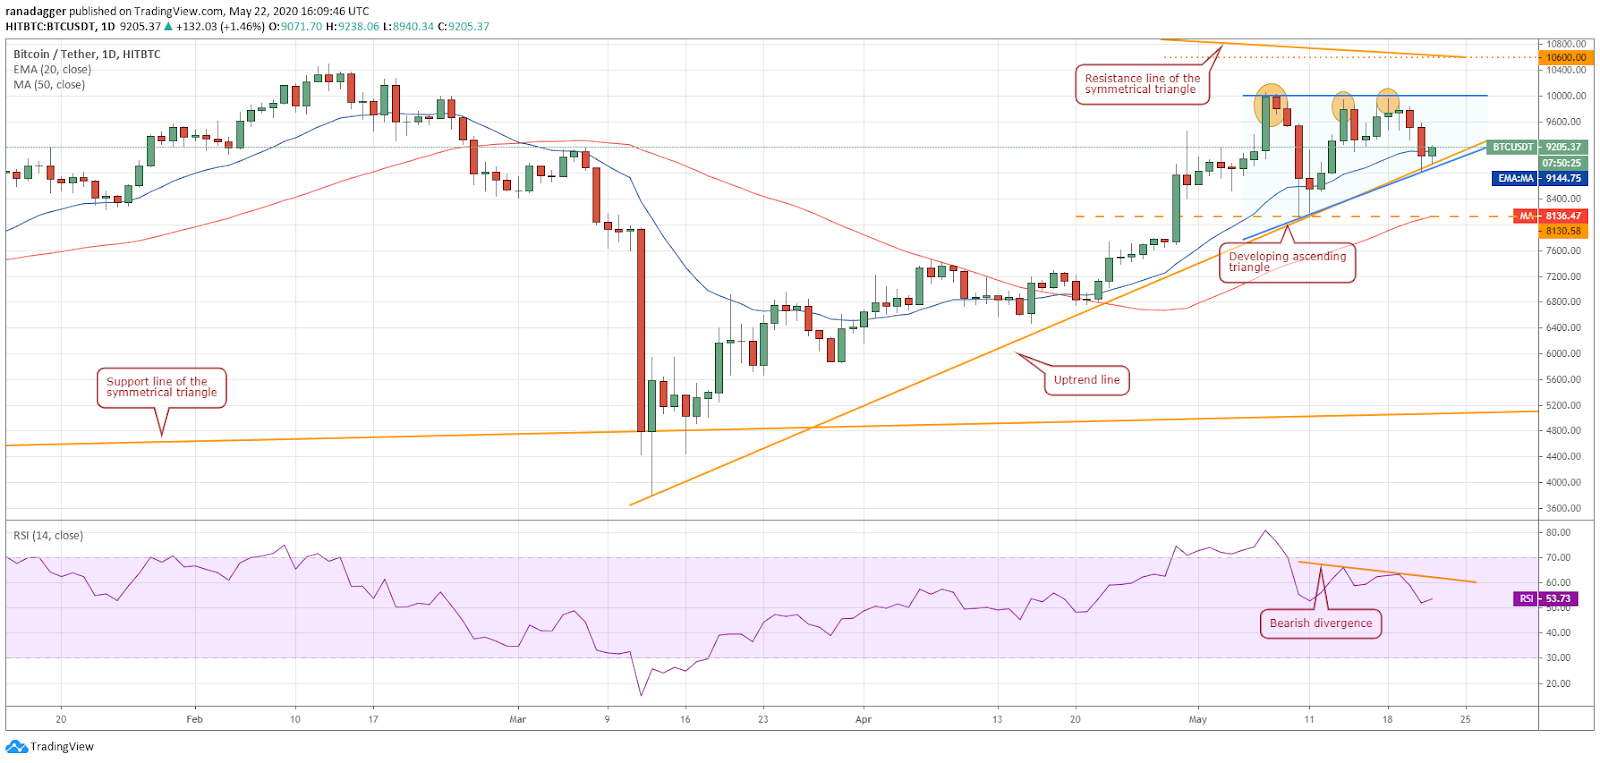
Repeated failure of the bulls to clear the $10,000 level attracted profit booking from the short-term traders. This dragged Bitcoin (BTC) below the 20-day exponential moving average ($9,145) on May 21 but the bulls defended the uptrend line.
BTC–USD daily chart. Source: Tradingview
Currently, the bulls are attempting to sustain the price above the 20-day EMA. If successful, the buyers will try to clear the hurdle at $10,000. We spot a possible ascending triangle pattern that will complete on a breakout and close (UTC time) above $10,000. This setup has a target objective of $11,869.
However, if the bulls fail to sustain the BTC/USD pair above the 20-day EMA, the bears will try to break the uptrend line. If the pair sustains below the uptrend line, a drop to $8,130.58 is possible.
If this support holds, the pair is likely to remain range-bound between $8,130.58-$10,058.52 for a few days. The trend is likely to turn negative if the bears sink the price below $8,130.58.
A buying opportunity might open up for the aggressive traders if the price sustains above $9,400. Alternatively, a rebound off $8,130.58 could also open up a buying opportunity.
ETH/USD
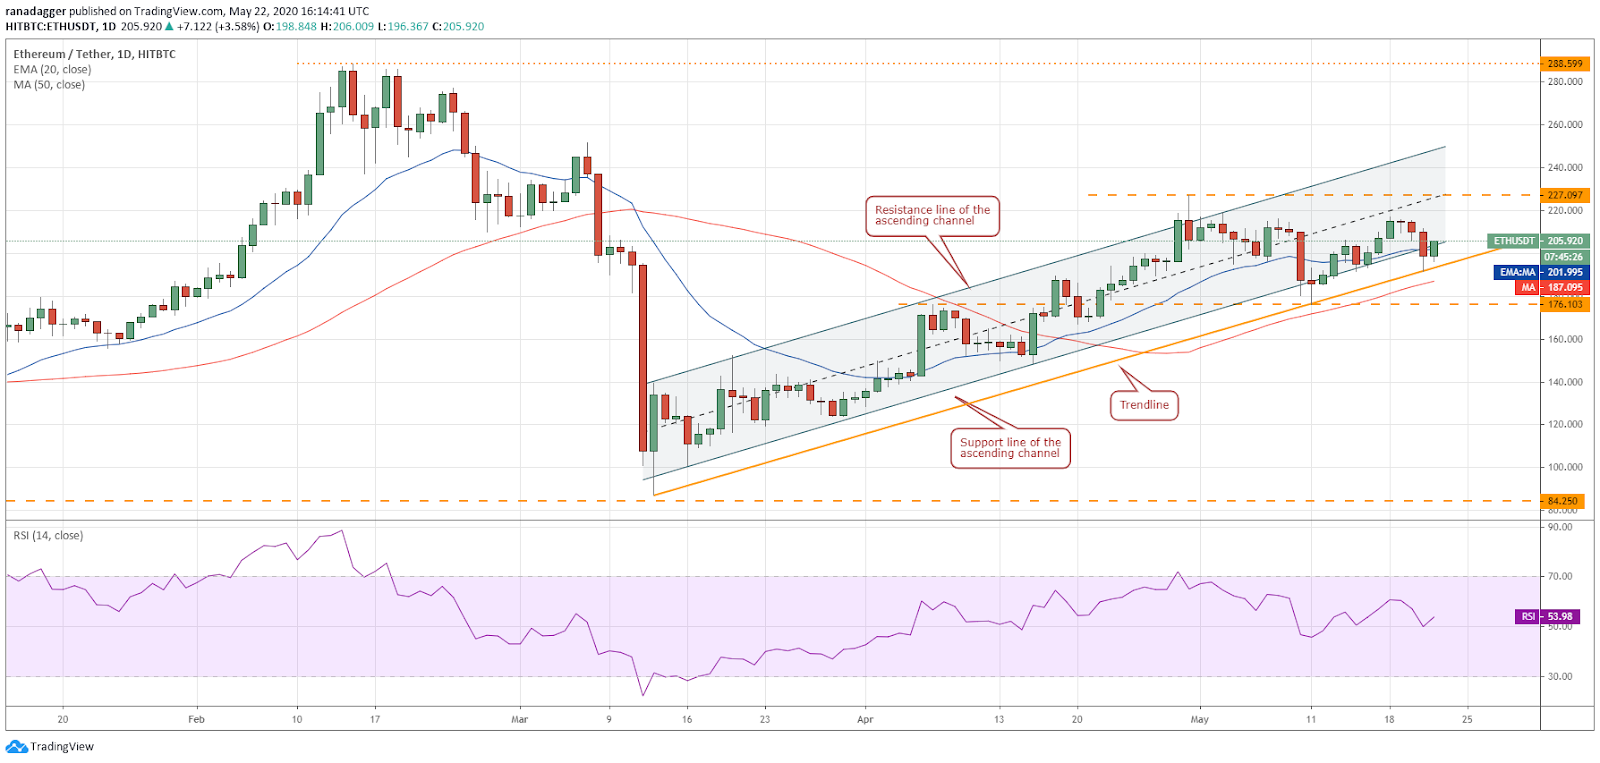
Ether (ETH) plunged below the support line of the ascending channel on May 21. However, the positive sign is that the bulls held the trendline support. This is the second time that the bulls have purchased the drop to the trendline. Hence, this becomes an important support to watch out for on the downside.
ETH–USD daily chart. Source: Tradingview
Currently, the bulls are attempting to push the price back into the channel. If successful, a rally to the $220-$227.097 range is possible. The aggressive traders can wait for the price to sustain inside the channel before looking for buying opportunities.
If the bulls fail to sustain the 2nd-ranked cryptocurrency on CoinMarketCap inside the channel, the bears will make one more attempt to break below the trendline. If successful, a drop to $176.103 is possible.
A break below the trendline will signal an end to the uptrend. If $176.103 holds, the ETH/USD pair might remain range-bound for a few days.
XRP/USD
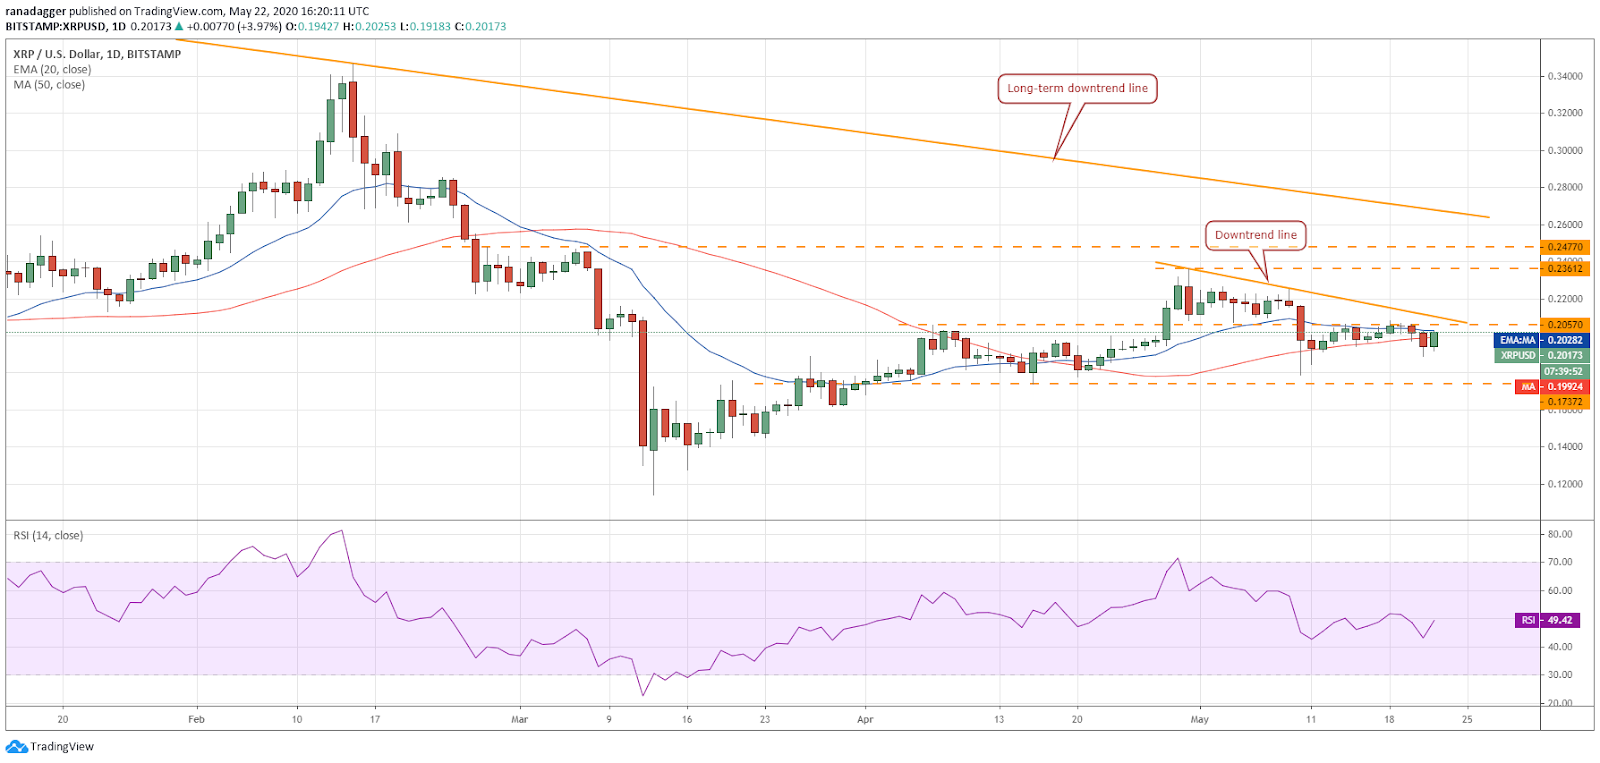
XRP turned around from the overhead resistance of $0.20570 and broke below the 50-day simple moving average ($0.199) on May 21. However, the bears could not keep up the selling pressure and drag the price to $0.17372.
XRP–USD daily chart. Source: Tradingview
The 3rd-ranked cryptocurrency on CoinMarketCap turned around from $0.1888 on May 21 and the bulls are currently attempting to push the price back above the moving averages. If successful, the bulls will make another attempt to break above the downtrend line.
If the price sustains above the downtrend line, a rally to $0.23612 is possible. The bulls can wait for the XRP/USD pair to close (UTC time) above the downtrend line before entering long positions. The stop-loss can be kept below $0.1800.
Conversely, if the bulls fail to propel the price above the moving averages, the bears will make another attempt to drag the price to $0.17372. A strong rebound off this support could also offer a buying opportunity.
BCH/USD
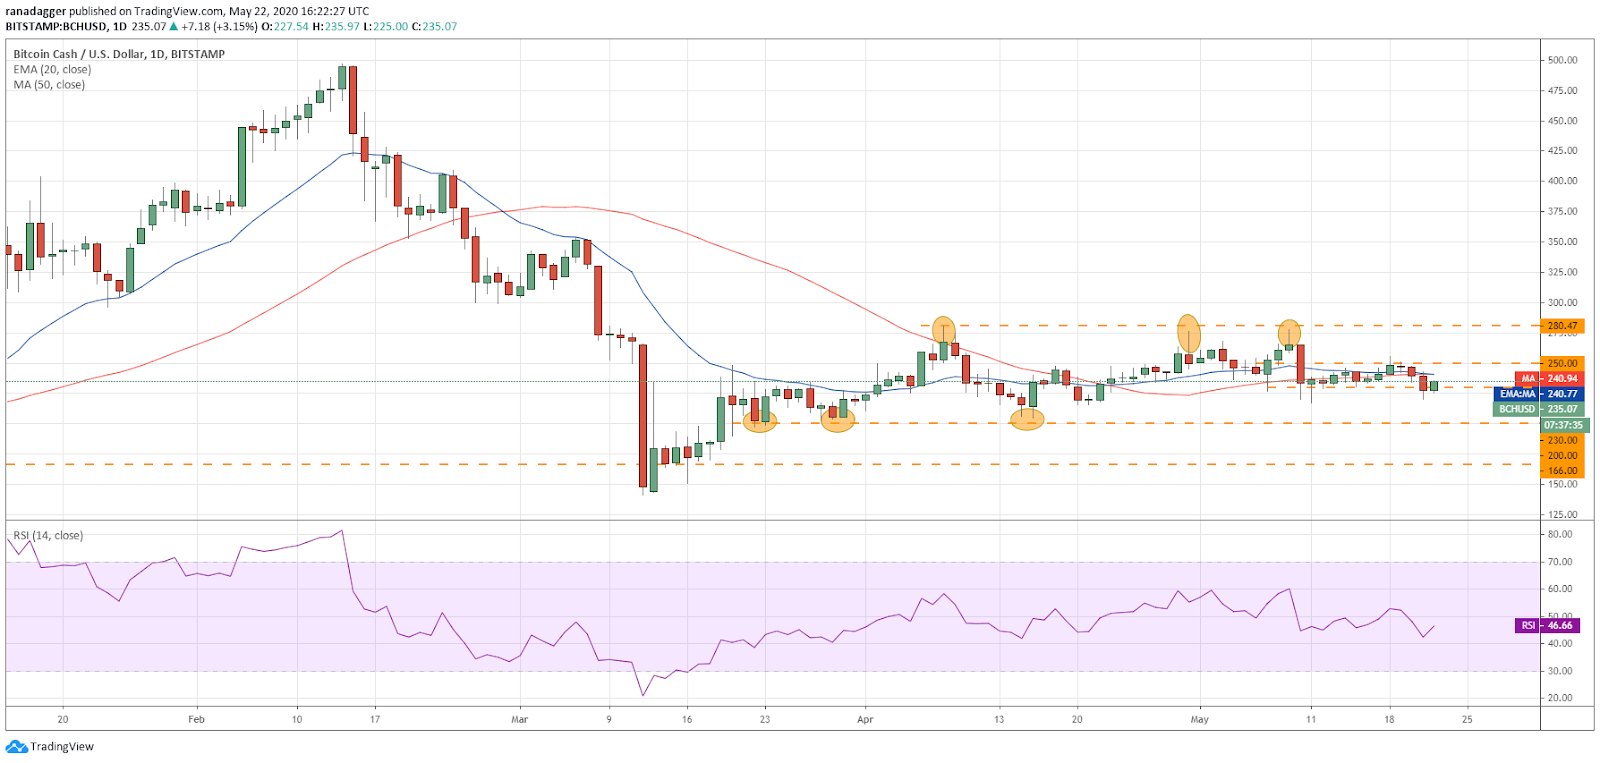
Bitcoin Cash (BCH) slipped below the $230-$250 range on May 21 but the bears have not been able to capitalize on the breakdown. This suggests a lack of selling at lower levels.
BCH–USD daily chart. Source: Tradingview
Currently, the bulls are attempting to sustain the 5th-ranked cryptocurrency on CoinMarketCap above $230. If successful, the price might remain stuck between $230-$250 once again.
Conversely, if the BCH/USD pair turns down from the moving averages, the bears might make one more attempt to sink the price to $200.
Buying opportunities could open up if the pair bounces off $200 or breaks out and sustains above $280.47. Until then, the traders can wait on the sidelines.
BSV/USD
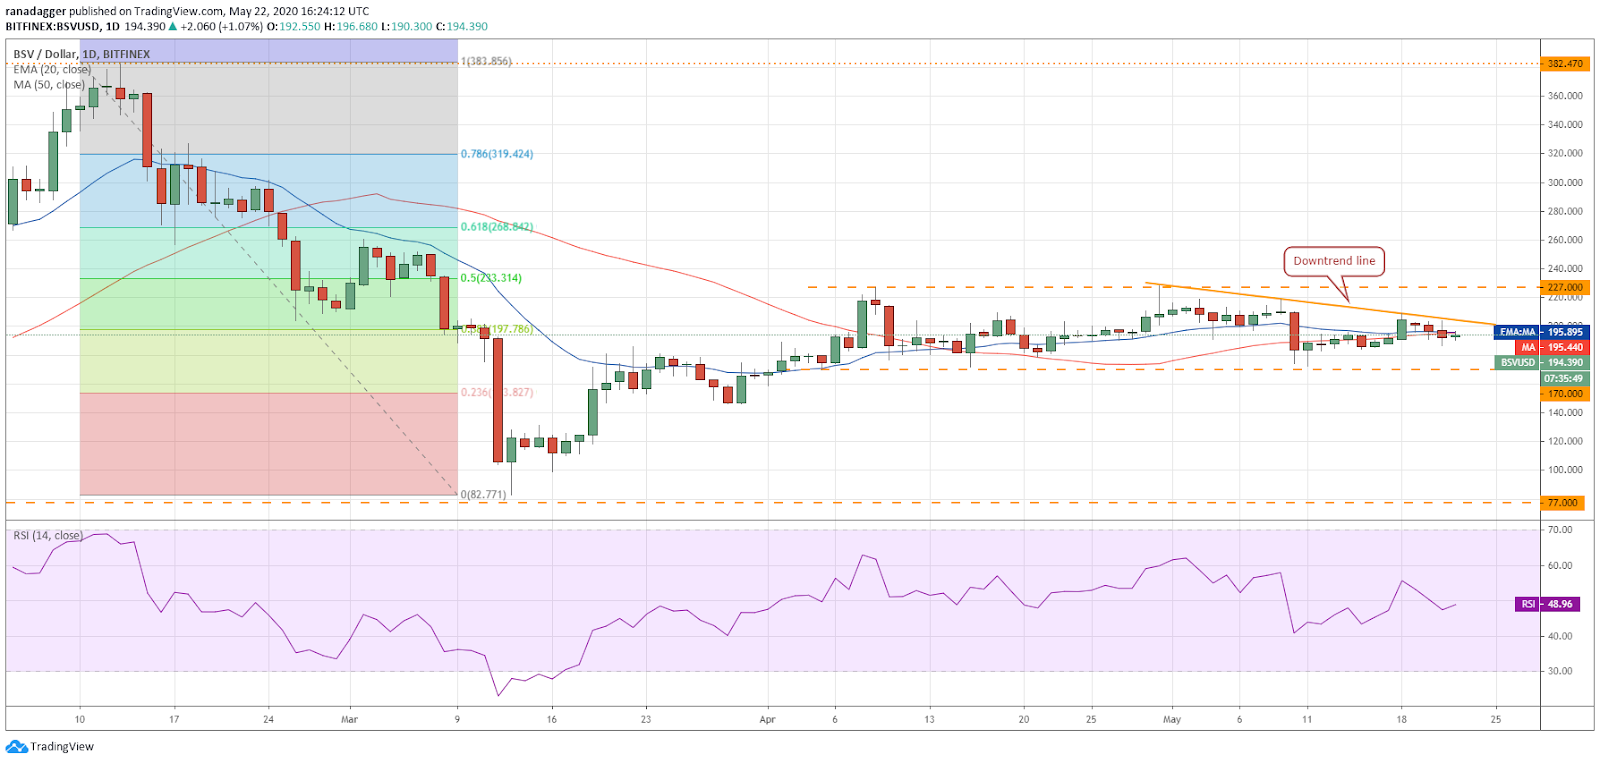
Bitcoin SV (BSV) has been oscillating above and below the moving averages for the past few days. This suggests a lack of conviction among the bulls and the bears about the next trending move.
BSV–USD daily chart. Source: Tradingview
Both the moving averages are flat and the relative strength index is just below the midpoint, which suggests a balance between supply and demand.
If the 6th-ranked cryptocurrency on CoinMarketCap climbs above the downtrend line, it will be the first sign of strength. Above this level, a move to $227 is possible. The momentum is likely to pick up if the bulls can sustain the price above $227. Hence, this could offer a buying opportunity.
Conversely, a break below $170 will be a sign that bears have overpowered the bears. Below this level, a drop to $146 is possible.
LTC/USD
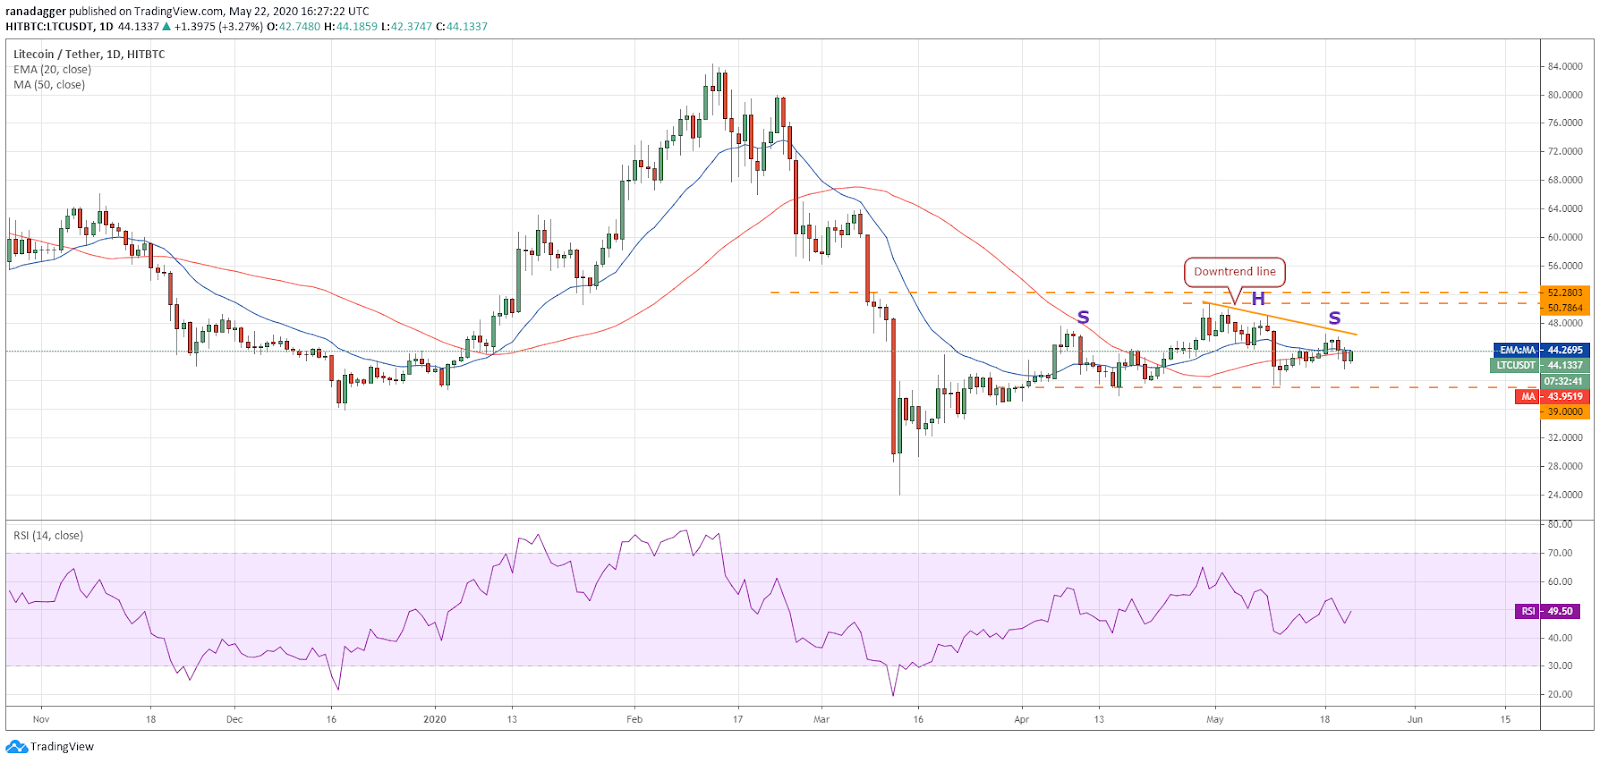
Litecoin (LTC) turned down from the downtrend line on May 20 and broke below the moving averages on May 21. If the bears can sink and sustain the price below the critical support of $39, the head and shoulders pattern will complete.
LTC–USD daily chart. Source: Tradingview
The bulls purchased the dip to $41.6167 on May 21 and are currently attempting to push the 7th-ranked cryptocurrency on CoinMarketCap towards the downtrend line. If the bulls can scale the price above the downtrend line, a move to $50.7864 is possible.
Conversely, if the LTC/USD pair again turns down from the downtrend line, the bears are likely to make another attempt to sink the price below $39. The pair remains weak until it does not break above the downtrend line.
BNB/USD
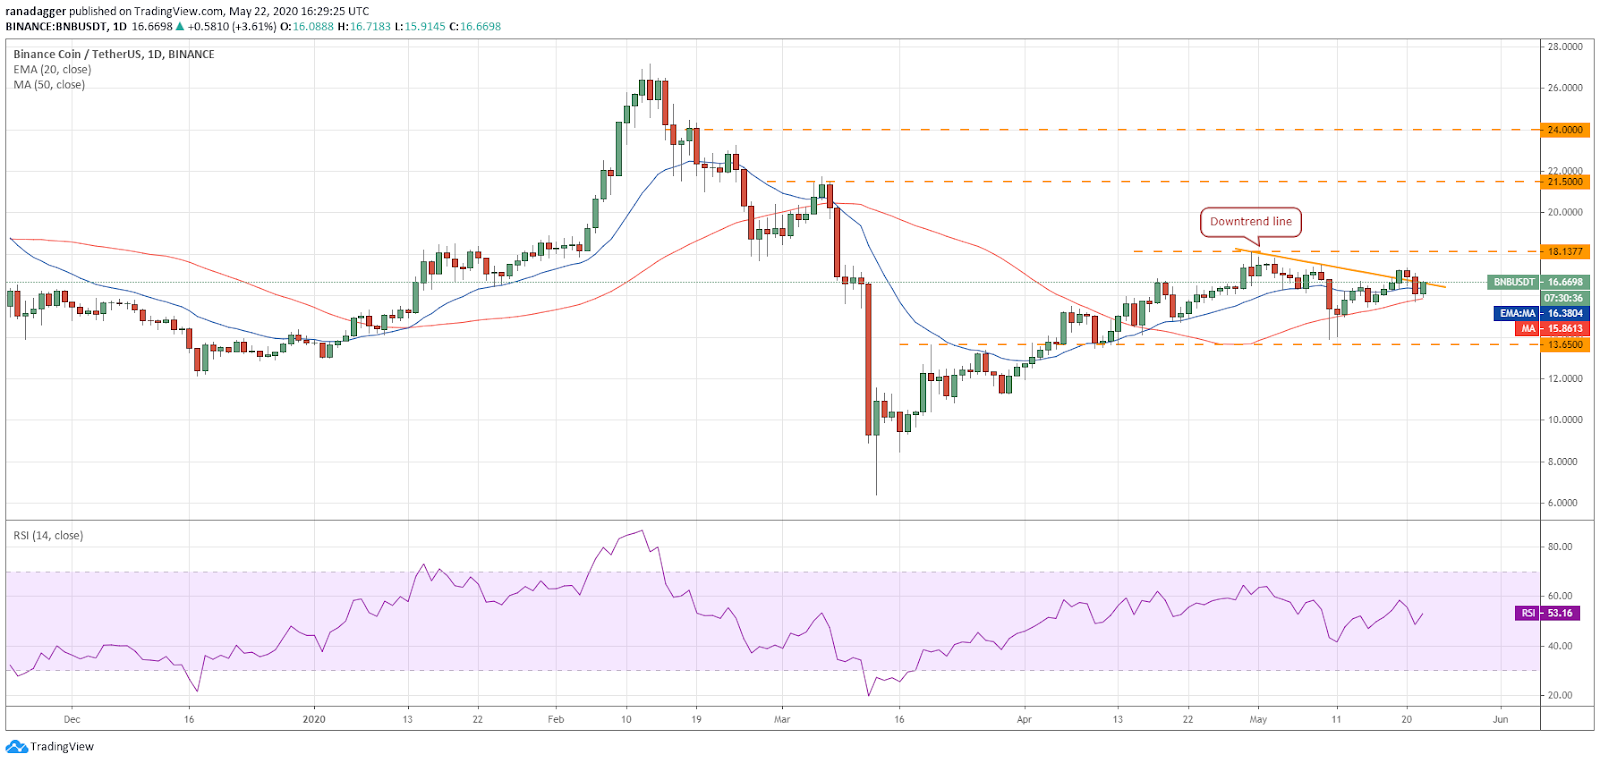
Binance Coin (BNB) broke above the downtrend line on May 19 but the bulls could not sustain the higher levels. On May 21, the bears again dragged the price below the downtrend line. This suggests a lack of buyers at higher levels.
BNB–USD daily chart. Source: Tradingview
However, the positive thing is that the bulls defended the 50-day SMA ($15.86) and are currently attempting to propel the 8th-ranked crypto-asset on CoinMarketCap back above the downtrend line.
If successful, a rally to $18.1377 is possible where the bears are likely to mount a strong defense. A breakout of $18.1377 can result in a rally to $21.50.
The bearish scenario would come into play if the BNB/USD pair fails to sustain above the downtrend line. In such a case, the bears will make another attempt to sink the pair below the 50-day SMA. If successful, a deeper correction to $15 and below it to $13.65 is possible.
EOS/USD
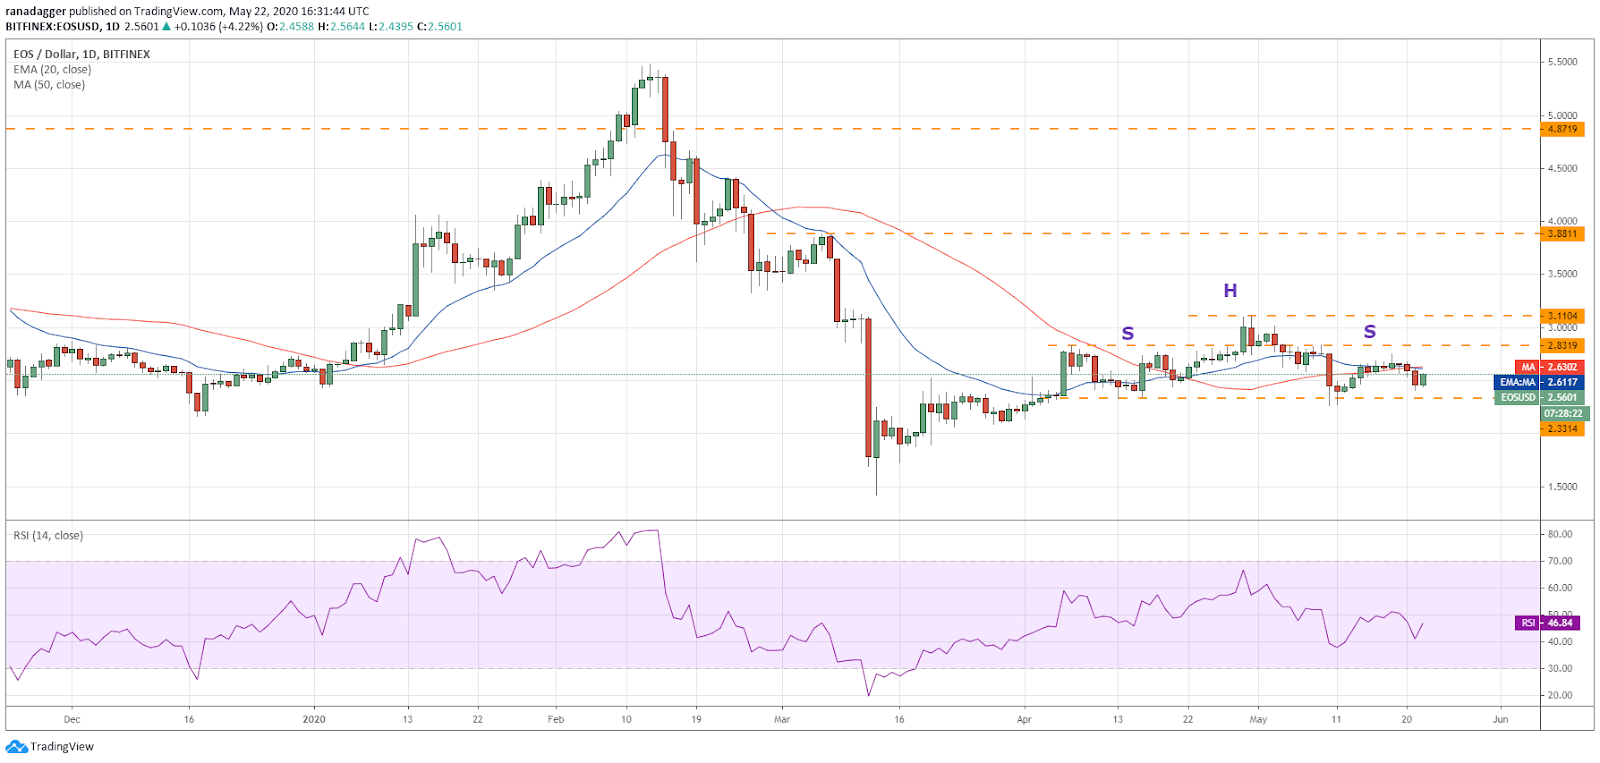
EOS looks weak as it has been struggling to move up for the past few days. If the bears can sink and close (UTC time) the price below the critical support of $2.3314, the bearish H&S pattern will complete. This setup has a target objective of $1.5524.
EOS–USD daily chart. Source: Tradingview
The H&S pattern will complete only if the 9th-ranked cryptocurrency on CoinMarketCap breaks below $2.3314.
On May 21, the bulls purchased the dip to $2.4059. This suggests that the bulls are attempting to defend the support at $2.3314. If the EOS/USD pair breaks above the moving averages, a rally to $2.8319 and then to $3.1104 is possible.
The moving averages are flat and the RSI is just below the midpoint, which suggests a balance between supply and demand. As there is no clear trend, the traders can sit on the sidelines.
XTZ/USD
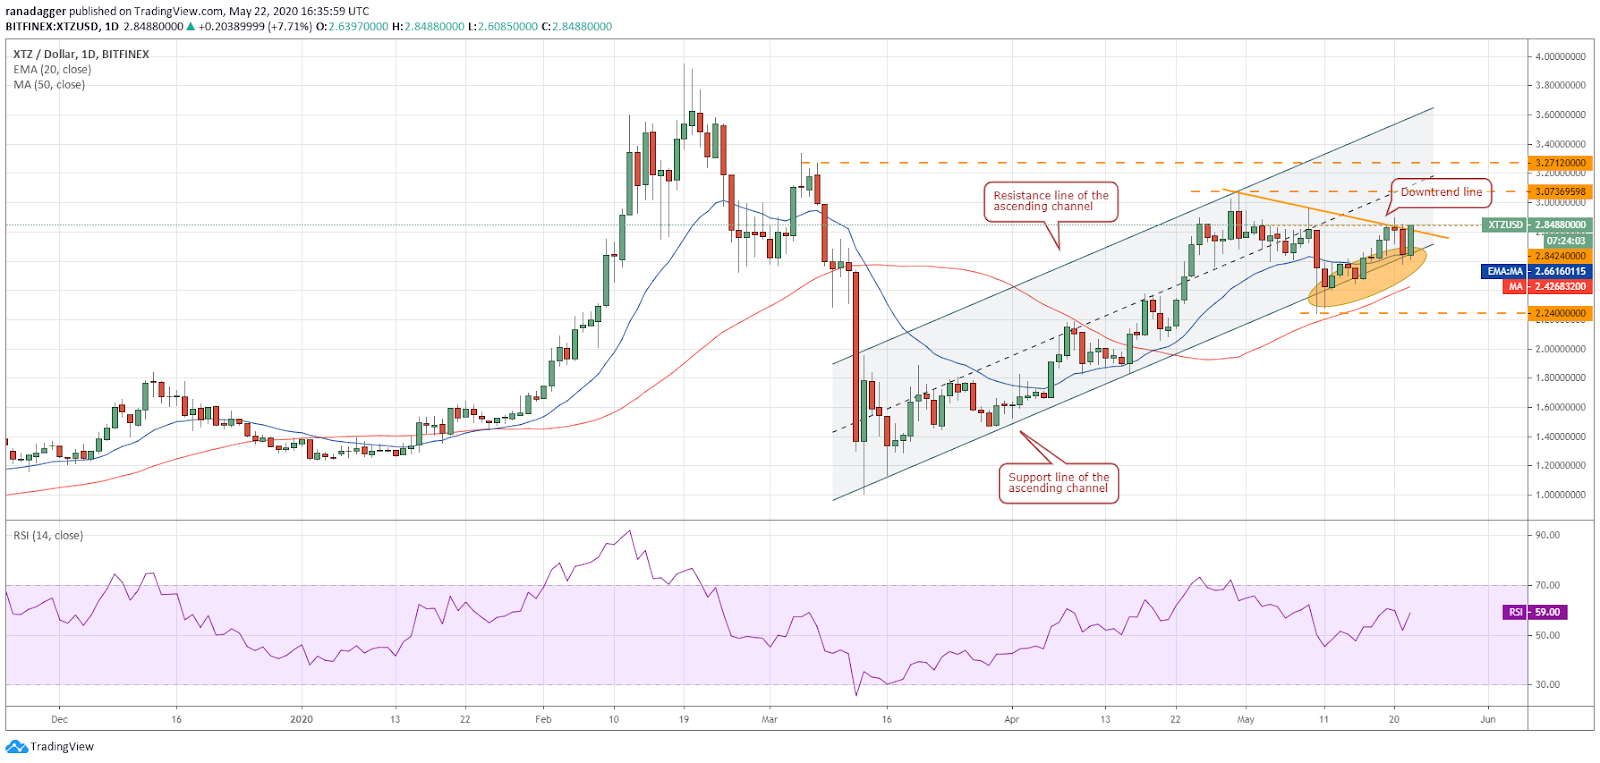
Tezos (XTZ) has been trading inside an ascending channel for the past few weeks, which shows that the trend is up. However, since May 10, the bulls have struggled to achieve a strong bounce off the support line of the channel. This suggests that buying dries up at higher levels.
XTZ–USD daily chart. Source: Tradingview
Currently, the bulls are attempting to sustain the 10th-ranked cryptocurrency on CoinMarketCap above the downtrend line. If successful, a rally to $3.07369 and then to $3.2712 is possible.
Traders can attempt to ride this move higher by buying after the price sustains above the downtrend line. If the momentum picks up, a rally to the resistance line of the channel at $3.60 could also materialize.
Conversely, if the XTZ/USD pair fails to sustain above the downtrend line and plummets below $2.55, it could drop to $2.24.
ADA/USD
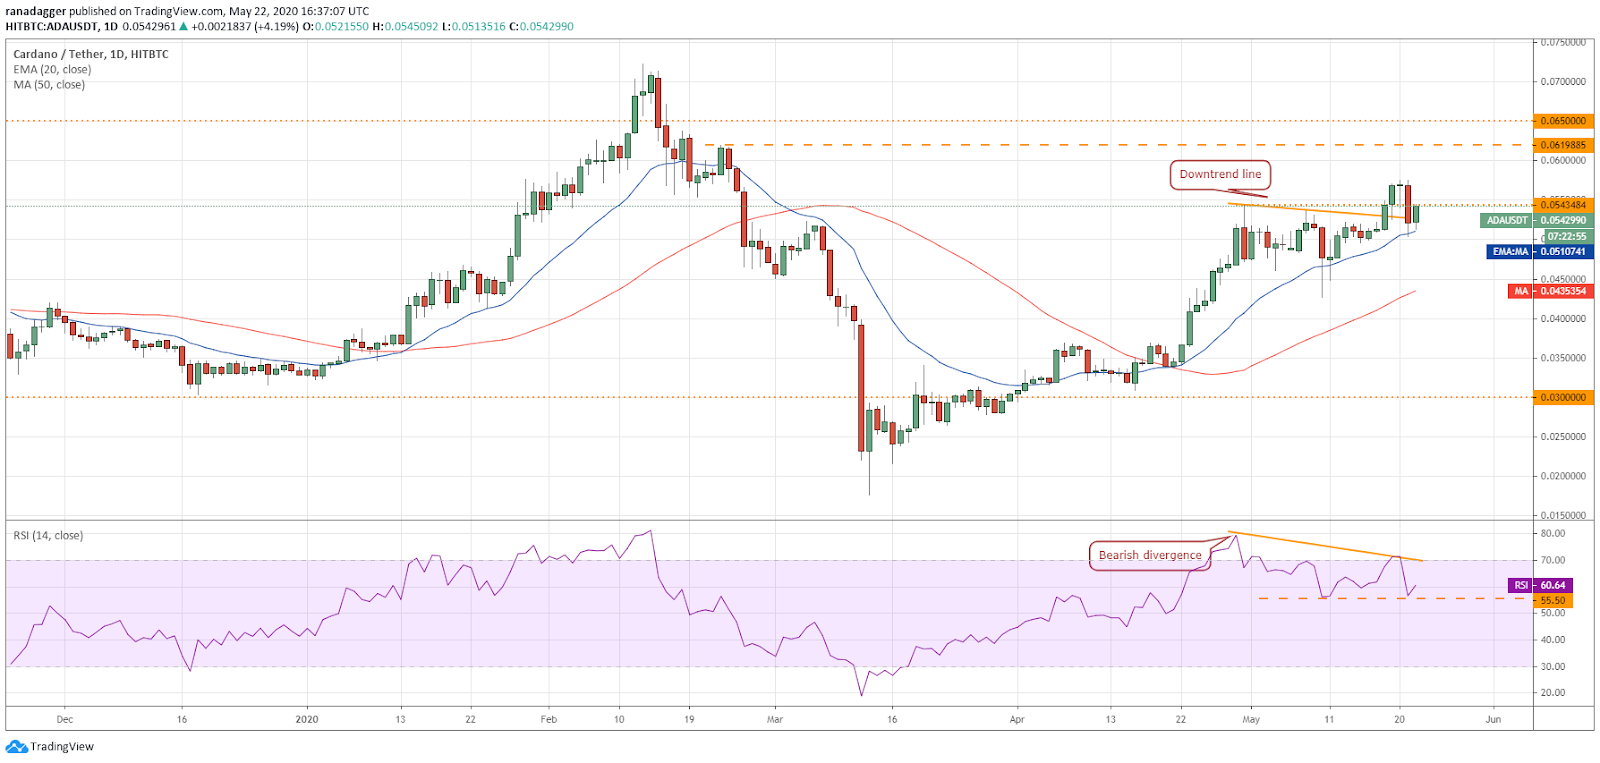
Cardano (ADA) is in an uptrend. The bears attempted to reverse the direction on May 21 but they could not break below the 20-day EMA ($0.051). This suggests that the sentiment is to buy the dips.
ADA–USD daily chart. Source: Tradingview
With both moving averages sloping up and RSI in positive territory, the advantage is with the bulls. Therefore, the 11th-ranked cryptocurrency on CoinMarketCap is now likely to move up to $0.057555 and then to $0.0619885.
This bullish view will be invalidated if the ADA/USD pair turns around from the current levels or from $0.057555 and breaks below $0.0504050. Below this level, the decline can extend to the next critical support at $0.0427288.
The views and opinions expressed here are solely those of the author and do not necessarily reflect the views of Cointelegraph. Every investment and trading move involves risk. You should conduct your own research when making a decision.
Market data is provided by HitBTC exchange.


