Although Bitcoin price is range-bound, a few altcoins have started a relief rally which could push them above key resistance levels.
The President of the European Central Bank (ECB) Christine Lagarde said that the coronavirus pandemic has acted as a catalyst in boosting the adoption of digital payments in the European Union. Lagarde expects the majority of the consumers to continue using digital services even in the future.
In order to support the digitalization, the ECB has formed a task force, which is “exploring the benefits, risks and operational challenges” of developing a digital euro and is expected to announce its findings within the next few weeks.
While a central bank digital currency might build up consumer interest in the short-term, it is unlikely to sustain because the stimulus measures announced across the globe since the start of the outbreak have reduced the confidence in fiat currencies.
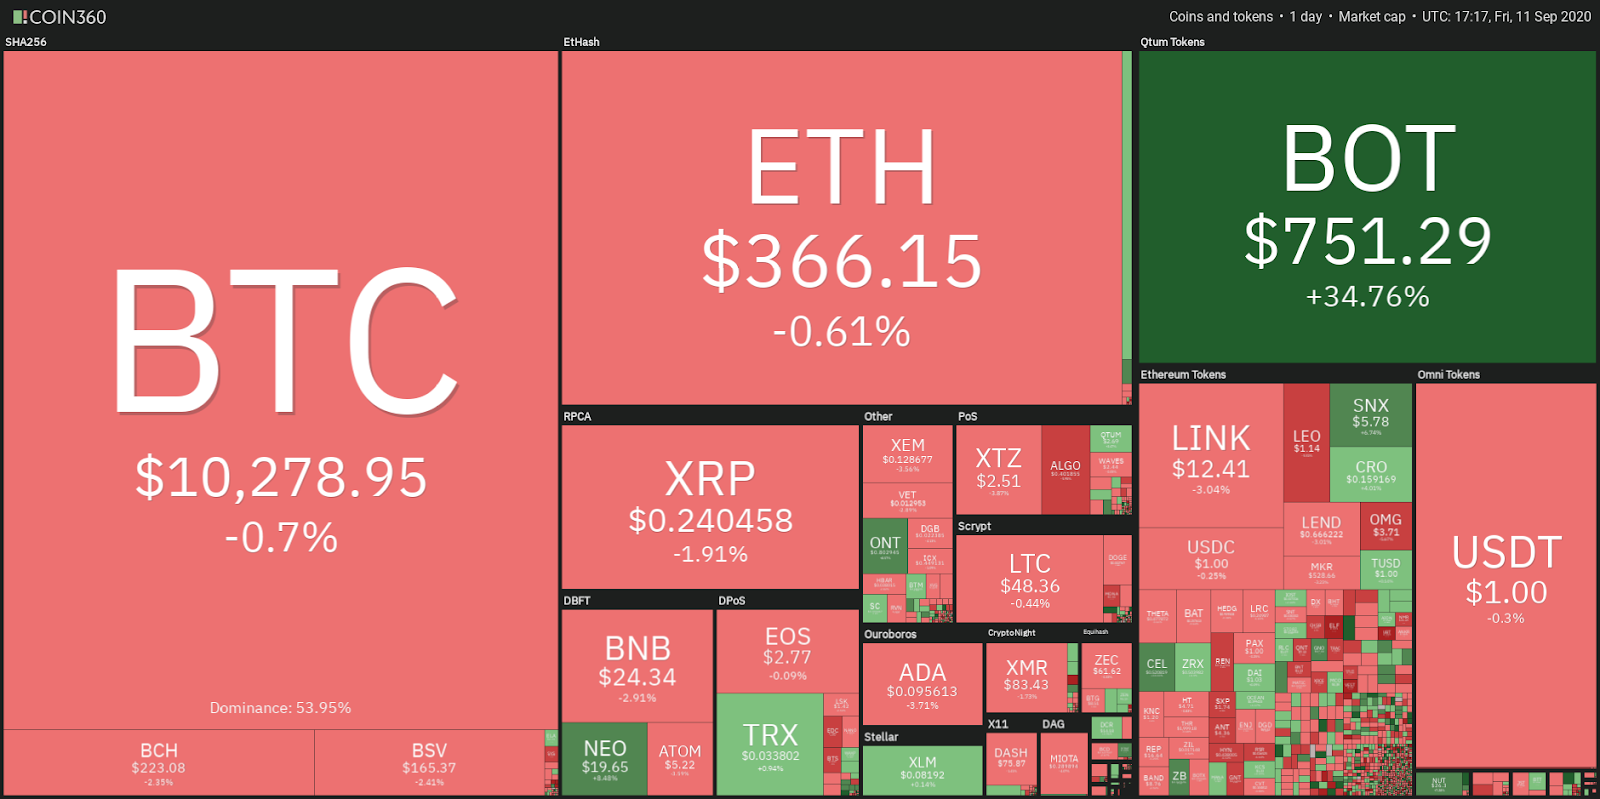
Daily cryptocurrency market performance. Source: Coin360
This has driven investors towards other assets such as stocks, gold and cryptocurrencies. Bloomberg’s crypto newsletter shows that the correlation between gold and Bitcoin (BTC), when calculated on a monthly basis has hit a 10-year high. This indicates that several investors are viewing Bitcoin as a safe haven asset similar to gold.
However, every asset goes through periodic corrections. Let’s analyze the charts of the top-10 cryptocurrencies to ascertain whether the correction is over or not.
BTC/USD
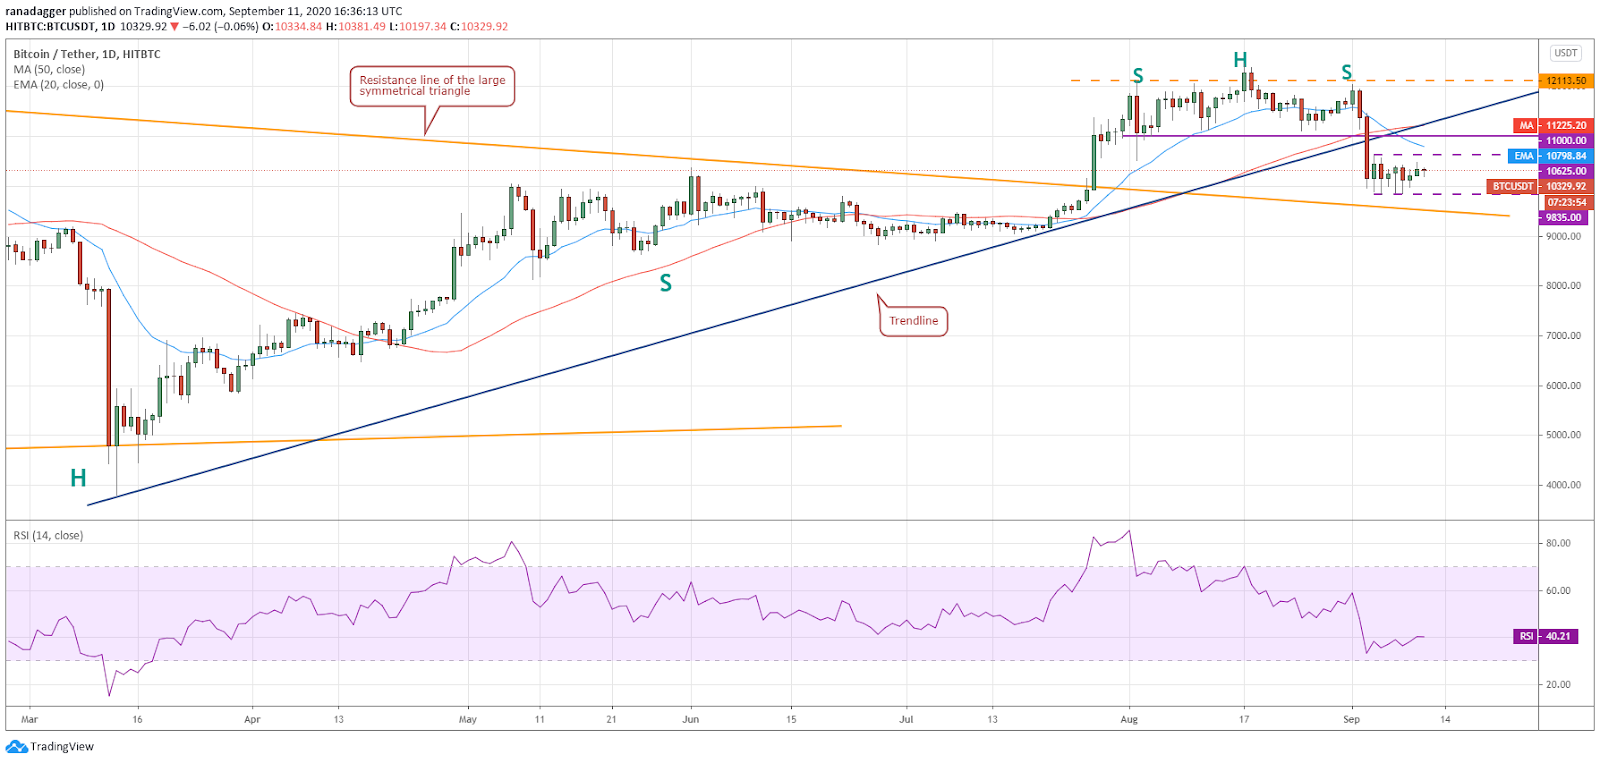
The bulls are currently attempting to push Bitcoin to the top of the $9,835–$10,625 range. The price action inside a range is usually random and it is difficult to predict the direction of the breakout with certainty.
BTC/USD daily chart. Source: TradingView
It is generally assumed that the breakout will happen in the direction of the trend that was prevailing before the range formed. In this case, the BTC/USD pair had dipped from the recent highs of $12,460, which shows that the bears had the upper hand.
The downsloping 20-day exponential moving average ($10,798) and the relative strength index in the negative zone also indicate that the advantage is with the sellers.
If the bears can sink the pair below $9,835, a drop to $9,000 and then to $8,000 is likely. Such a move will be a huge negative.
However, if the bears fail to capitalize on this advantage, the aggressive bulls are likely to start accumulating and they will try to push the price above $10,625. If they succeed, a move to $11,000 and then to $12,460 is likely.
ETH/USD
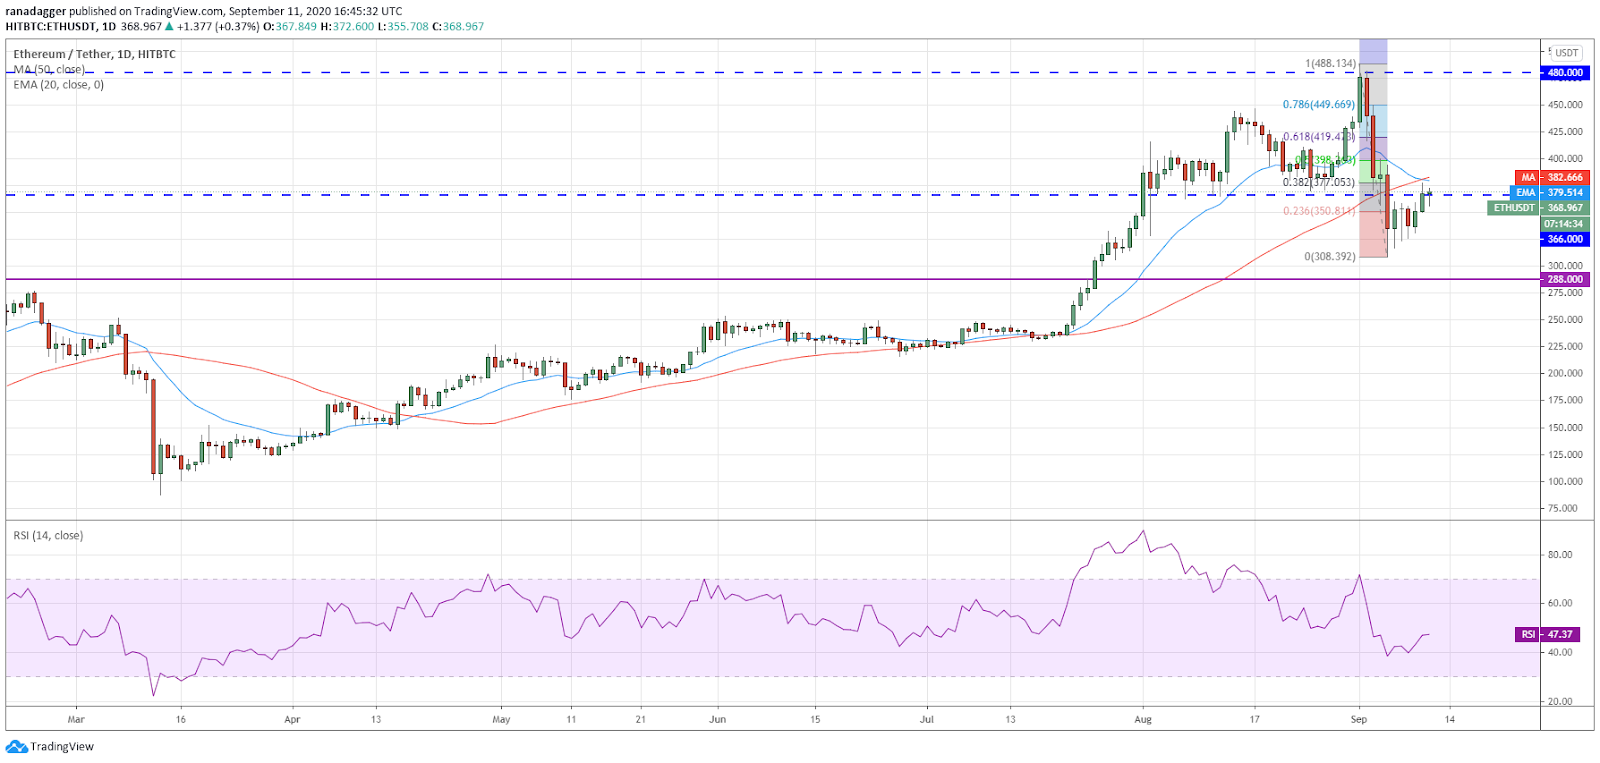
Ether (ETH) rose above the $366 resistance on Sep. 10 but the bulls are facing resistance at the 20-day EMA ($379), which is close to the 38.2% Fibonacci retracement of the most recent fall.
ETH/USD daily chart. Source: TradingView
However, if the bulls do not give up much ground, it will increase the possibility of a break above the 20-day EMA. If the ETH/USD pair sustains above this resistance, a move to the 61.8% Fibonacci retracement level of $419.473 is likely.
The bears will once again attempt to defend this level but if the bulls can overcome their challenge, a retest of $488.134 will be on the cards.
Contrary to this assumption, if the pair turns down from the current levels and dips back below $350, the bears will try to sink the price to $308.392. The selling is likely to intensify on a break below $288.
XRP/USD
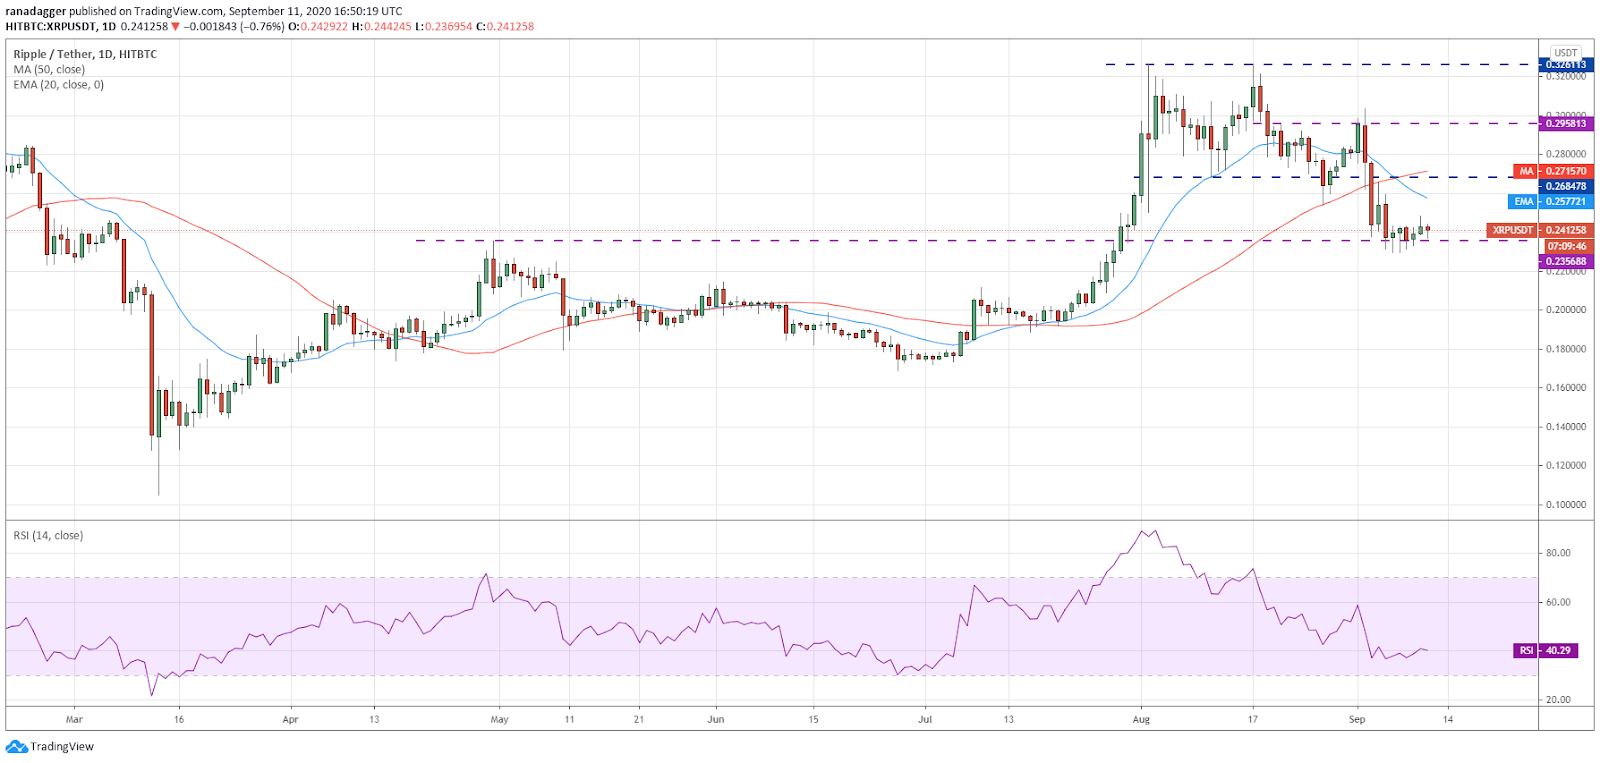
The bulls attempted to start a relief rally on Sep. 10 but could not sustain above $0.245, which shows that demand dries up at higher levels. As a result, XRP has again dipped back to the $0.235688 support.
XRP/USD daily chart. Source: TradingView
If the bears sink the XRP/USD pair below $0.229582, the next leg of the down move is likely to begin. The next support on the downside is the $0.19–$0.20 zone.
The downsloping 20-day EMA ($0.257) and the RSI in the negative territory suggest that bears are in command.
However, if the pair rebounds off the current levels and rises above $0.250, it can move up to the 20-day EMA and above it to $0.268478. A break above this level will suggest that the bulls are back in the game.
LINK/USD
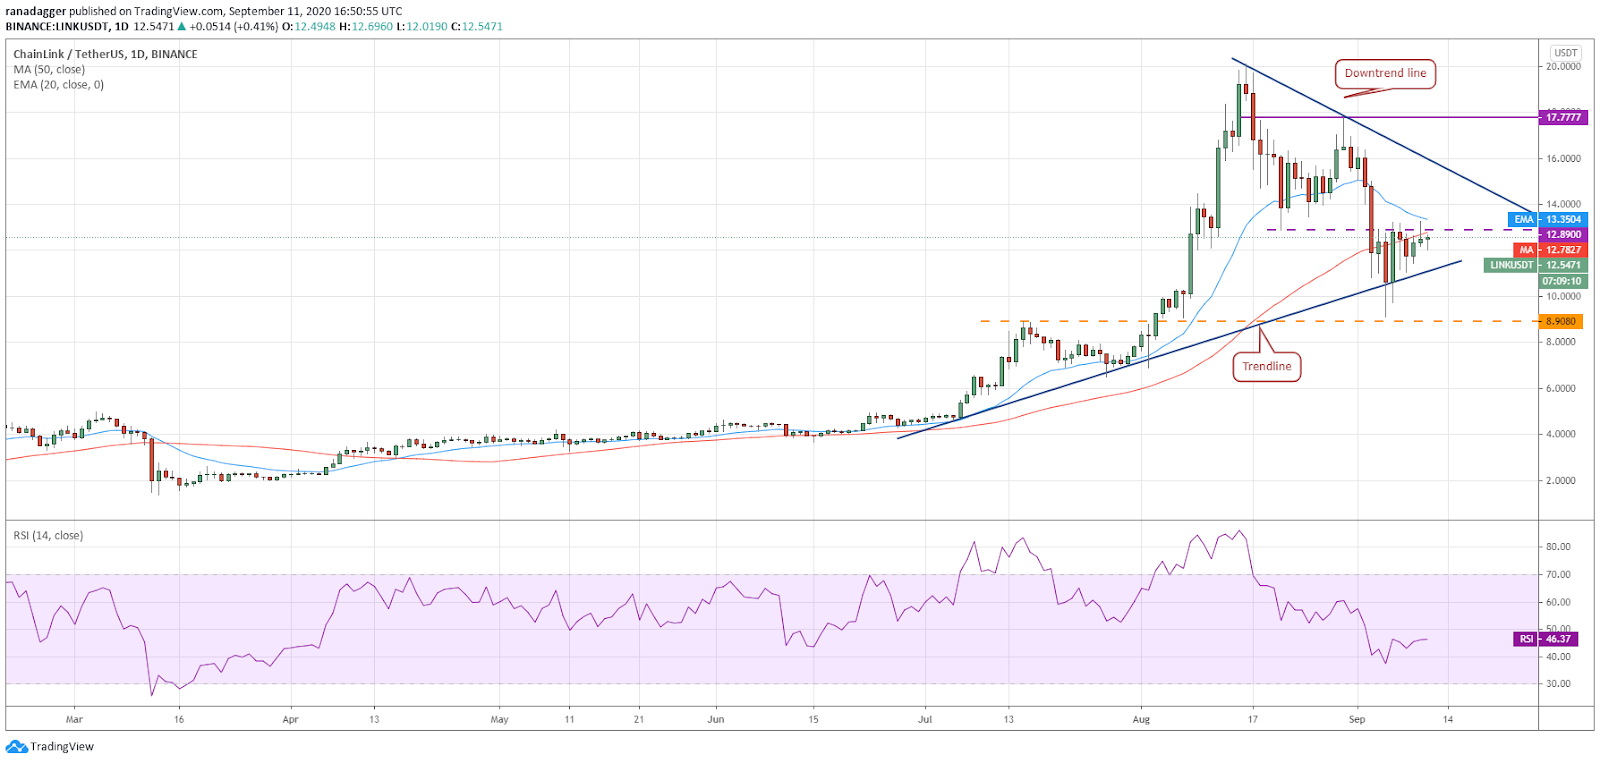
Chainlink (LINK) had broken above the $12.89 overhead resistance but the bulls could not push the price above the 20-day EMA ($13.35), which suggests that the bears are aggressively selling on rallies.
LINK/USD daily chart. Source: TradingView
If the bears can keep up the selling pressure and sink the LINK/USD pair below the trendline, a drop to $8.9080 is possible. A break below this support will be a huge negative.
Conversely, if the pair rises from the current levels or from the trendline, the bulls will once again attempt to scale the price above the 20-day EMA. If they succeed, a relief rally to the downtrend line is likely.
A breakout of this resistance will increase the likelihood of a rally to $17.77 and then to the highs at $20.1111.
BCH/USD
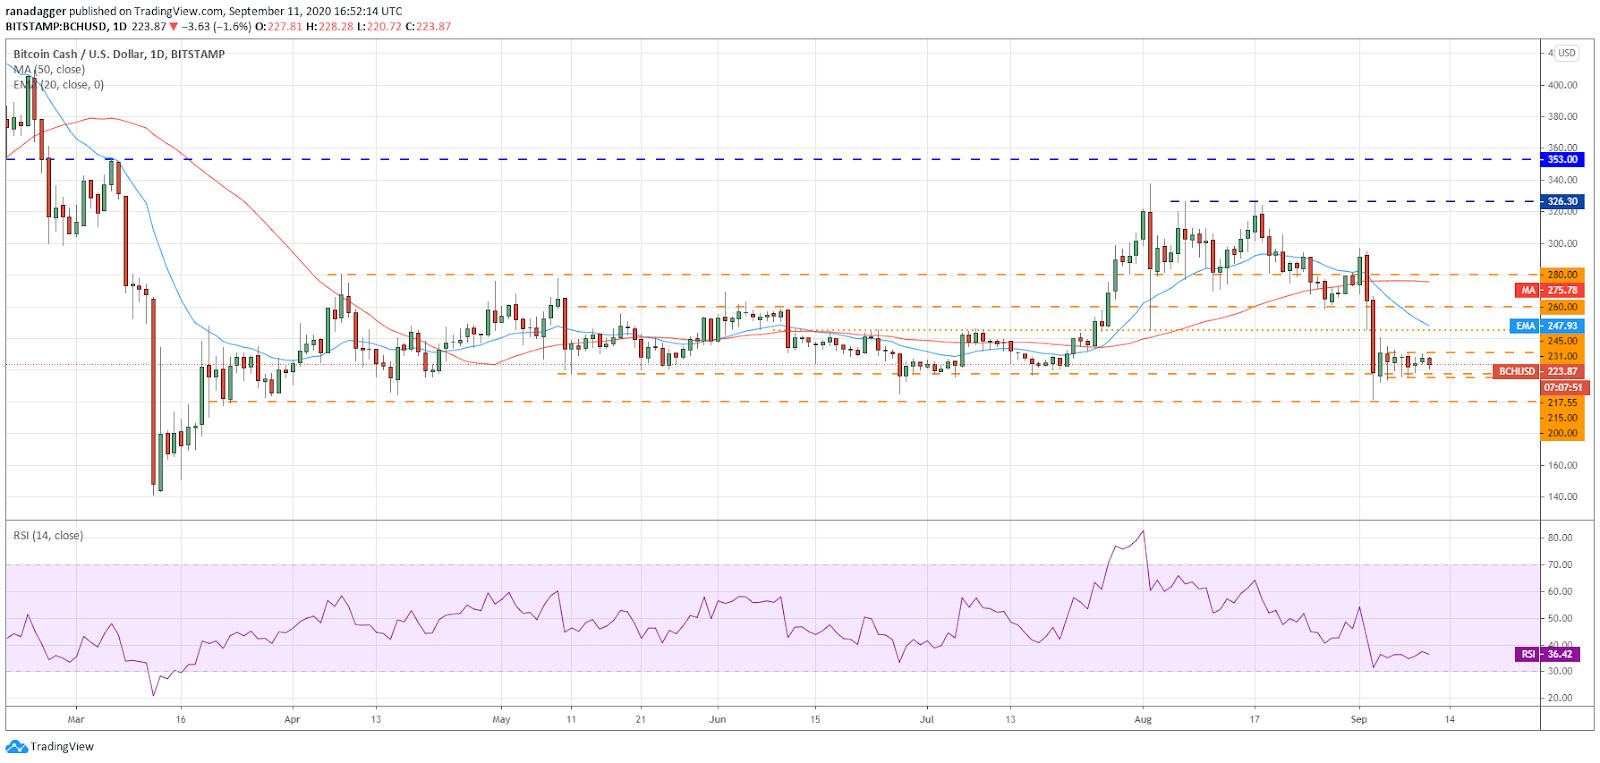
Bitcoin Cash (BCH) has roughly been trading in the tight range of $215–$231 for the past few days, which suggests indecision among the bulls and the bears about the next directional move.
BCH/USD daily chart. Source: TradingView
The downsloping 20-day EMA ($248) and the RSI below the 40 level suggest that bears have the upper hand.
If they can sink the price below $215, a retest of the critical support at $200 is possible. A breakdown of this support will be a huge negative that can result in a fall to $140.
Conversely, if the bulls can push the price above $231, the likelihood of a rally to $245 increases. Above this level, a move to $260 and then to $280 is possible.
DOT/USD
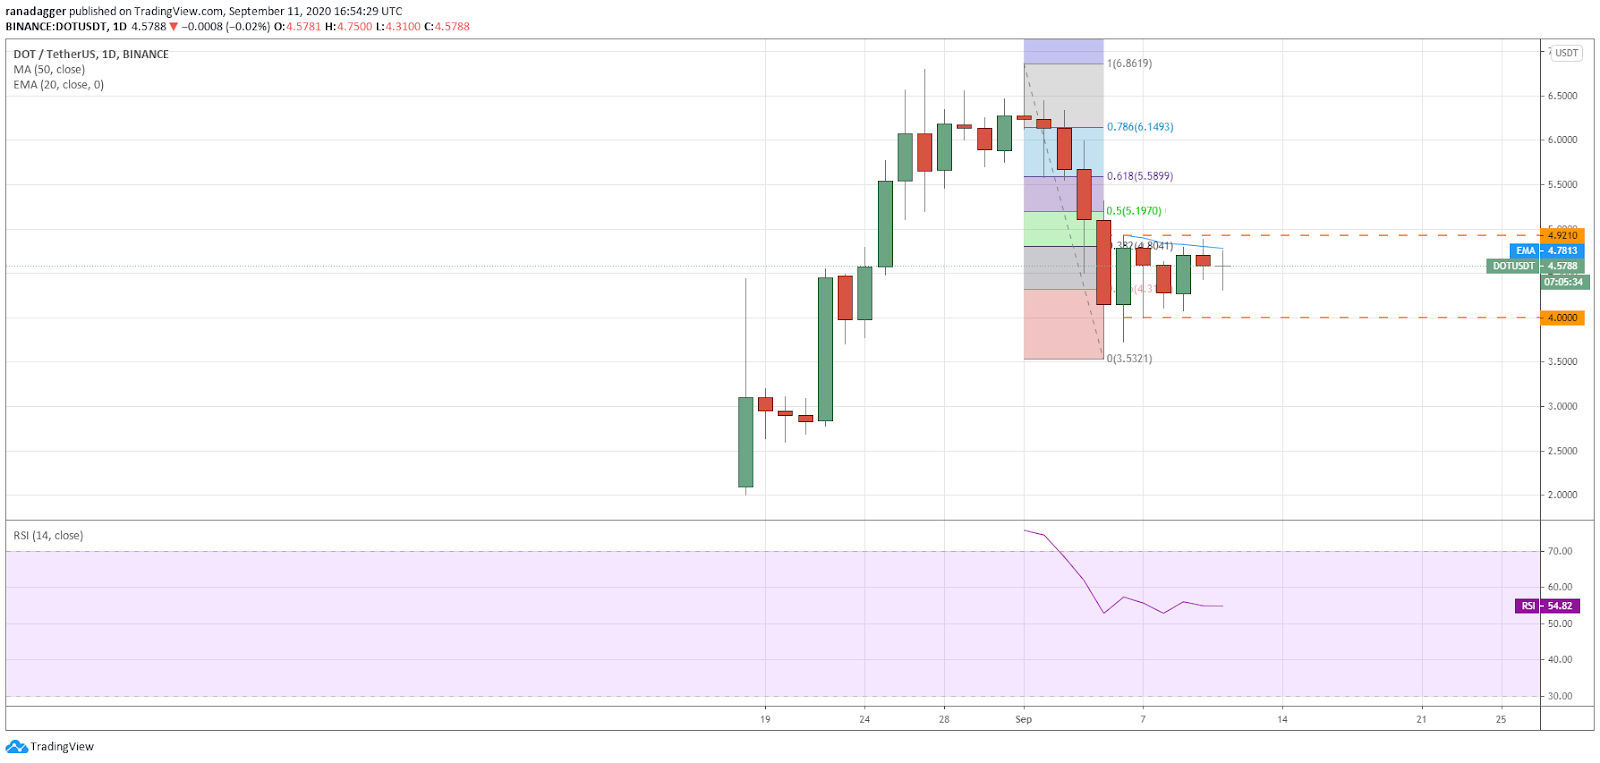
The bulls could not push Polkadot (DOT) above the $4.9210 resistance on Sep. 10, which suggests that the bears are defending this level.
DOT/USD daily chart. Source: TradingView
The bears will now try to sink the DOT/USD pair below the $4–$3.50 support. If they succeed, a drop to $3 and then to $2 is possible.
However, if the price turns up from the current levels or the $4 support, the bulls will again try to push the price above $4.9210. If they succeed, a rally to the 61.8% Fibonacci retracement level of $5.5899 is possible.
Between $4 and $4.9210, the price action is likely to be random. The longer the time spent inside the range, the stronger will be the eventual breakout from it.
BNB/USD
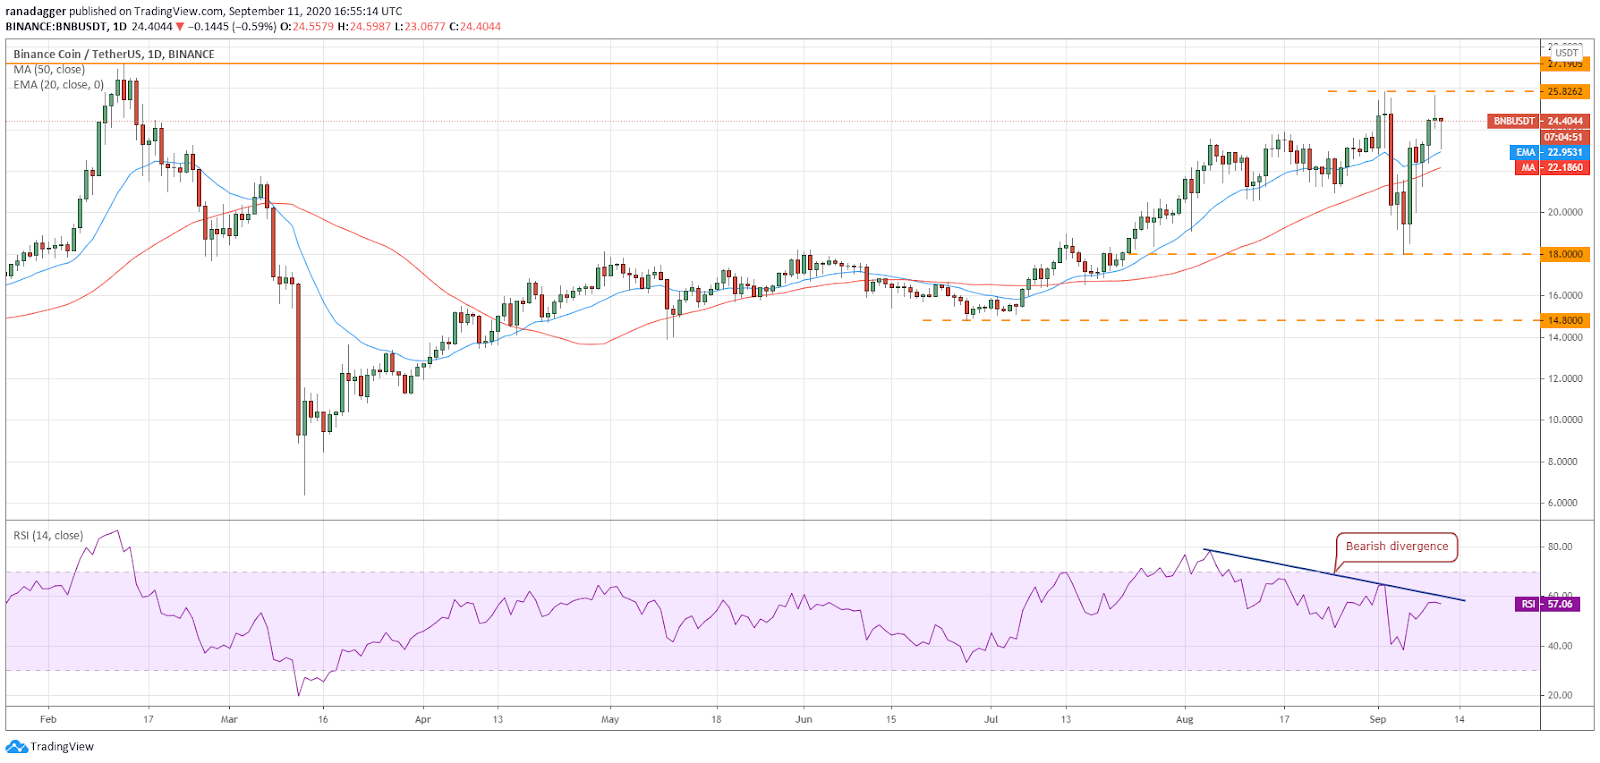
Binance Coin (BNB) turned down from the $25.8262 resistance on Sep.10, which shows that the bears are defending this level. The RSI has formed a bearish divergence, which suggests that the bullish momentum has weakened.
BNB/USD daily chart. Source: TradingView
If the bears can sink the BNB/USD pair below the moving averages, it will be the first sign of weakness, which could result in a drop to $18.
However, both moving averages are sloping up, which suggests that the advantage is still with the bulls.
The pair has currently bounced off the 20-day EMA ($22.95), which suggests buying on dips by the bulls. They will now again try to propel the price above $25.8262 and if they succeed, a rally to $27.1905 is likely.
LTC/USD
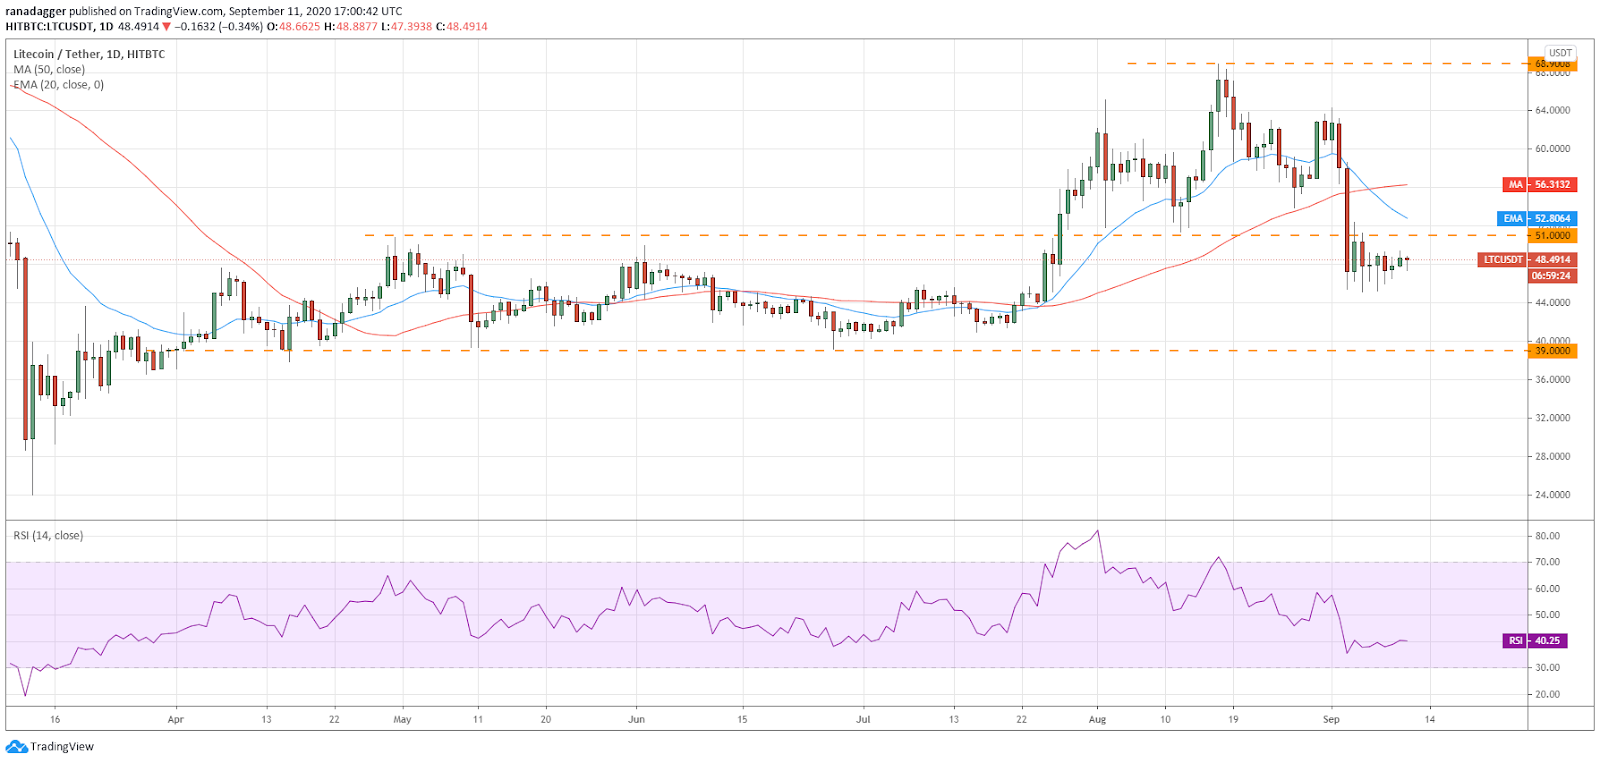
The bulls are struggling to push Litecoin (LTC) to the overhead resistance at $51, which suggests a lack of demand even at the current levels.
LTC/USD daily chart. Source: TradingView
If the bulls do not push the price above the $51 resistance within the next few days, the bears will make an attempt to sink the LTC/USD pair below $45. If they succeed, a retest of the critical support at $39 is possible.
Conversely, if the bulls can push the price above the $51 resistance and the downsloping 20-day EMA ($52.8), it will signal strength. The next target on the upside is likely to be $56 and then $64.
CRO/USD
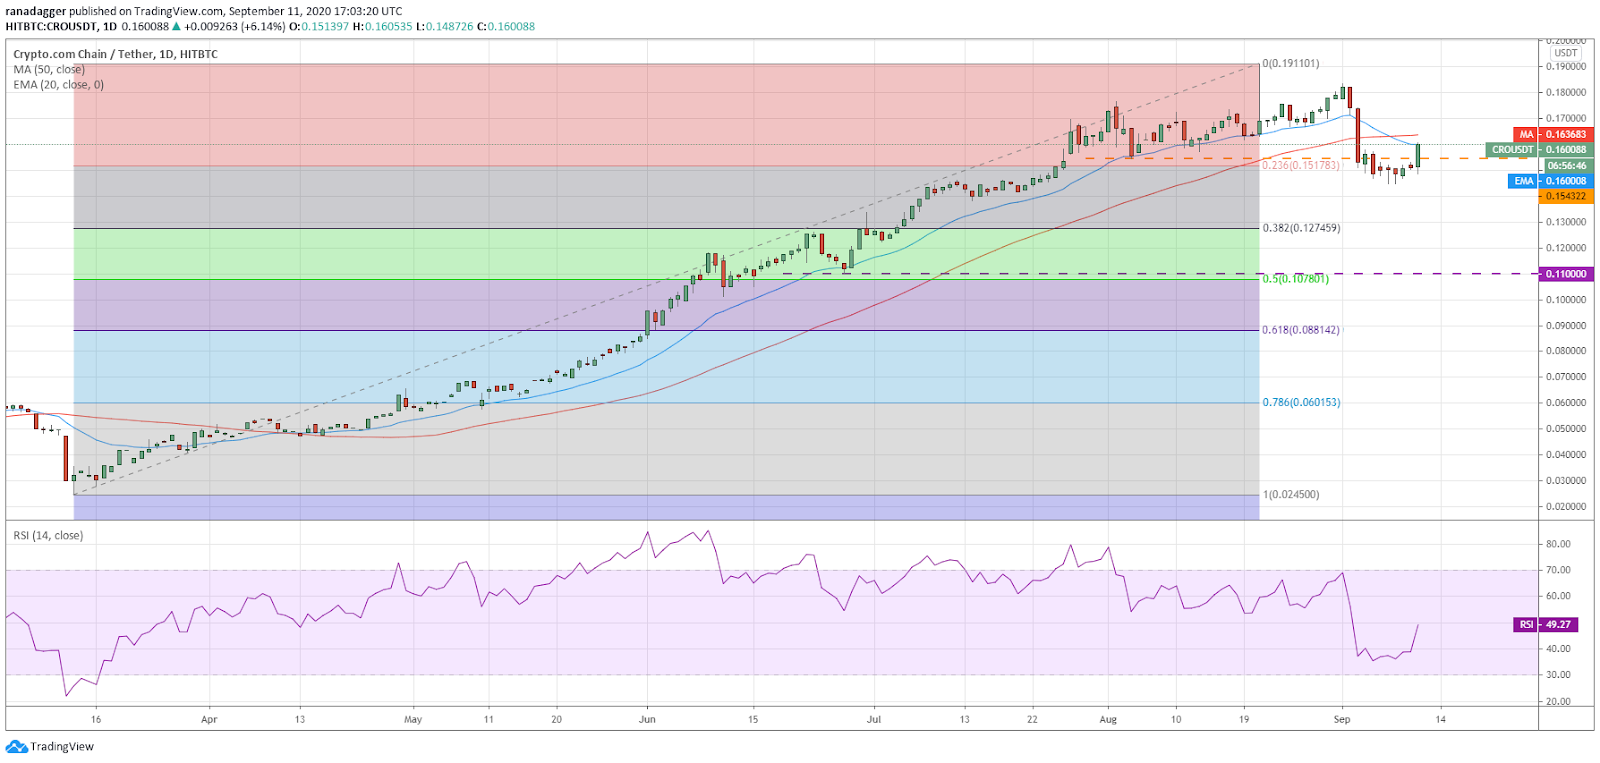
Crypto.com Coin (CRO) has broken above the $0.154322 resistance and has reached the 20-day EMA ($0.260), which is a positive sign as it shows a lack of selling pressure at lower levels.
CRO/USD daily chart. Source: TradingView
If the bulls can push the CRO/USD pair above this resistance, a retest of the $0.183416–$0.191101 resistance zone is likely. A breakout of this zone could start the next leg of the uptrend.
Contrary to this assumption, if the bears aggressively defend the 20-day EMA, the pair could again dip back to the $0.144743 support. A break below this support could pull down the price to the 38.2% Fibonacci retracement level of $0.127459.
BSV/USD
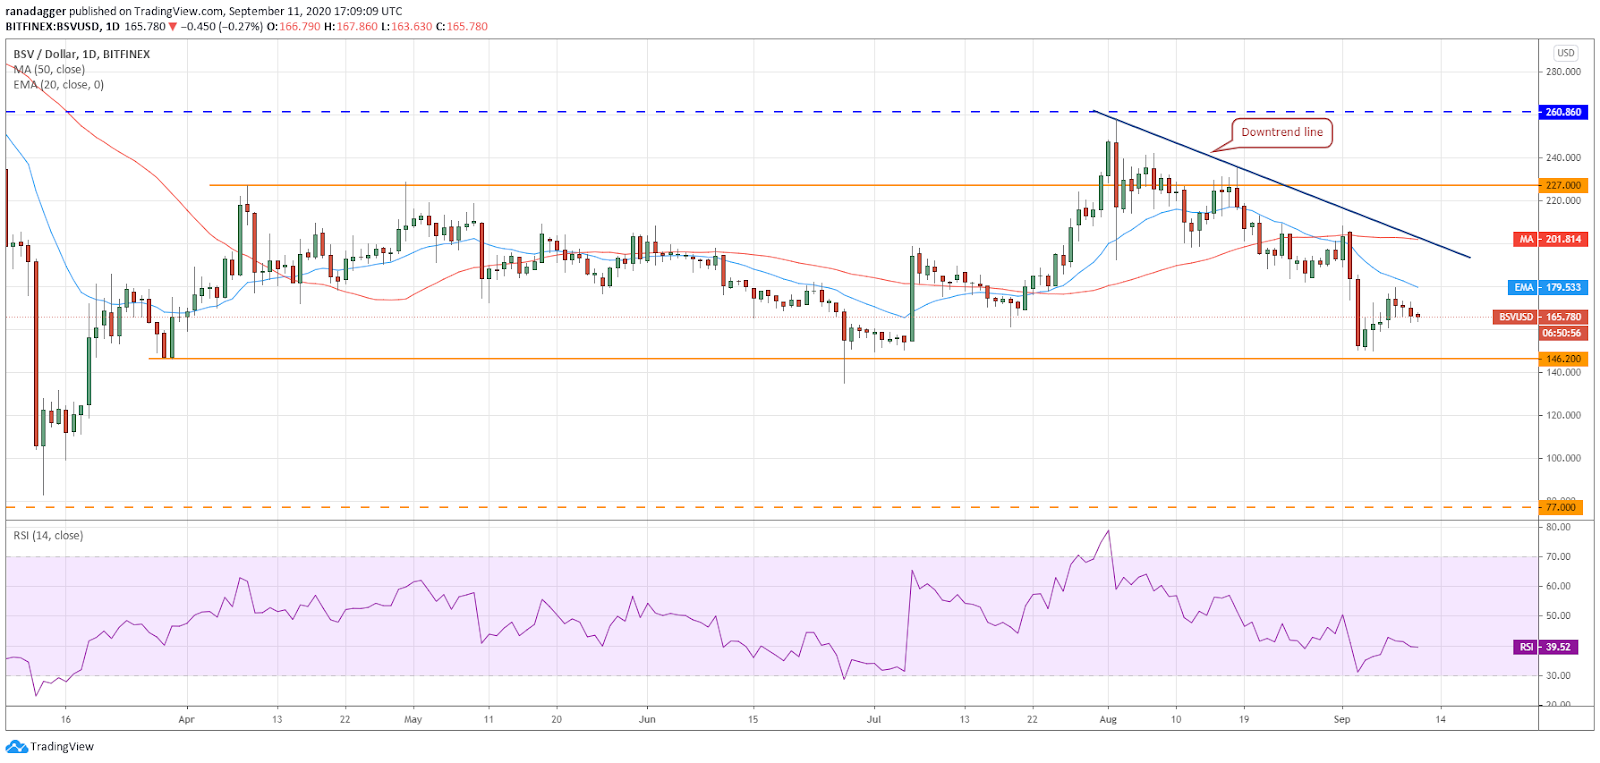
The relief rally in Bitcoin SV (BSV) hit a wall close to the 20-day EMA ($179), which could have attracted profit booking by the traders who had purchased the recent dip to $150 levels.
BSV/USD daily chart. Source: TradingView
If the bears can now sink the price below the immediate support at $160, a drop to the critical support zone of $146.20–$135 is likely. A break below this zone will be a huge negative that can result in a fall to $100.
Contrary to this assumption, if the BSV/USD pair rebounds off the current levels, the bulls will once again try to push the price above the 20-day EMA. If they succeed, a move to the downtrend line is possible.
The views and opinions expressed here are solely those of the author and do not necessarily reflect the views of Cointelegraph. Every investment and trading move involves risk. You should conduct your own research when making a decision.
Market data is provided by HitBTC exchange.


