CCN is expanding. Are you our next full-time journalist from the West Coast USA? Send us your CV and examples here.
The Ripple market segment witnessed a 21 percent recovery upon establishing a new November low at $0.329.
The XRP/USD rate on Monday touched 0.399-fiat in a higher high formation on BitFinex. In the meantime, the coin’s market cap reached close to $15.61 billion, replacing Ethereum to become the world’s second-largest cryptocurrency.
Ripple’s chief marketing strategist Cory Johnson on Friday furthered their dialogue about how XRP is better than Bitcoin. Not that his statements could have rattled the bitcoin investors, but they certainly could have attracted potential holders. Johnson wrote about how bitcoin was more centralized due to being extremely influenced by the Chinese mining community, calling it a poor technology.
-Bitcoin has some real technological limitations
-The digital asset that show fundamental use cases will develop a fundamental value
-XRP is being used more than Bitcoin being used as of todayCory Johnson, Ripple
Nov18#XRP #XRPthestandard pic.twitter.com/hmpqXNFTtT— Steven Diep (@DiepSanh) November 23, 2018
The XRP correction nevertheless took place in the absence of solid backings, meaning its sustainability cannot be guaranteed at this moment. At worst, it could be a bear pennant formation which indicates the continuation of the current downward trend. At best, XRP could be heading to an extended upside recovery action, considering its the least-bad performing cryptocurrency in the bear run that has shaken the entire crypto market.
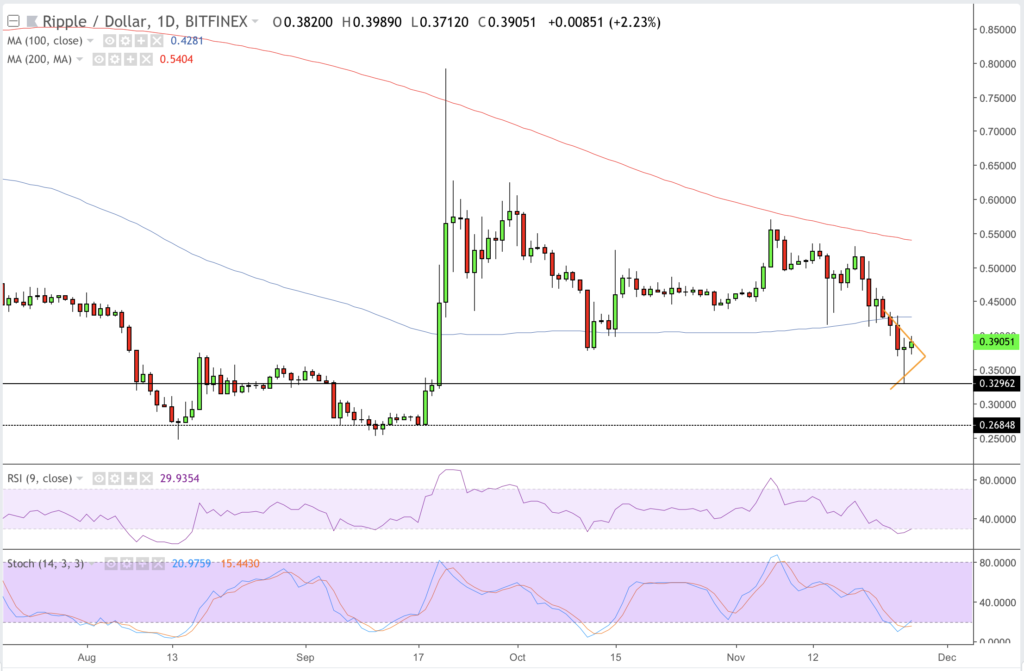
The daily XRP chart, meanwhile, allows a better inside look, revealing RSI and Stochastic had lately dipped into their oversold regions. The XRP/USD rate at most corrected to stabilize, meaning the near-term uptrend should extend to the nearest resistance level, probably towards the 100-period simple moving average before a potential pullback overtakes the trend.
At the same time, 0.329-fiat is providing decent support according to the daily basis. The level had witnessed buying sentiment before and promised to hold the bears with few bulls. A break below 0.329, on the other hand, could be devastating as it would expose XRP/USD to a crash towards the next potential downside at 0.268-fiat. This level has offered strong support since August.
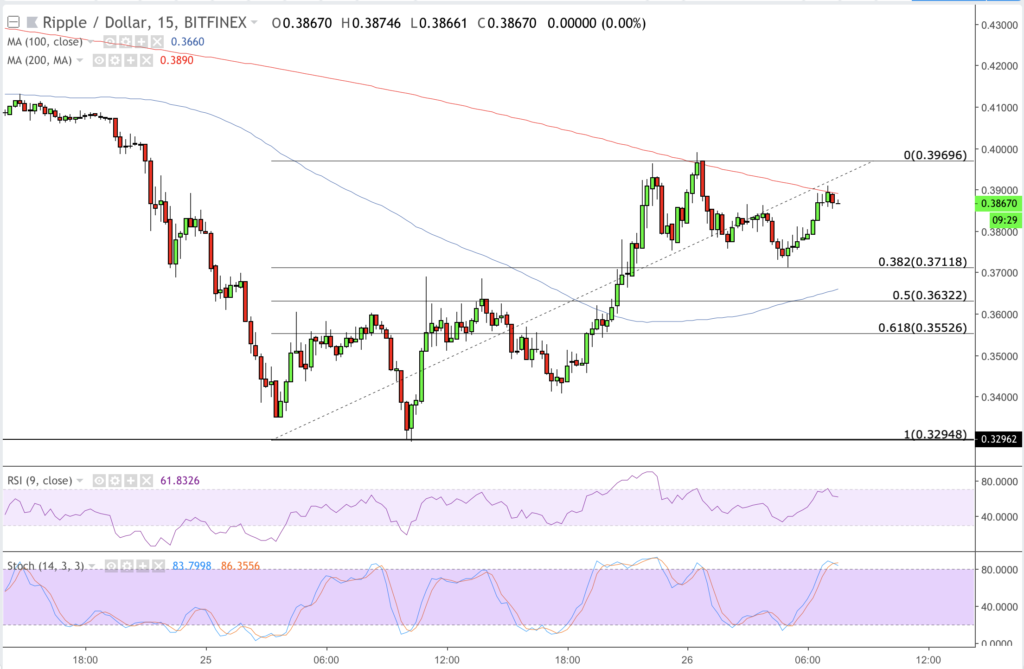
A narrowed down version of the XRP/USD rate chart offers us more insights into how we could play the trades intraday. As of now, the pair is clearly targetting 0.396-fiat as its interim resistance while resting its foot at 0.371-fiat, the interim support for the rest of the day.
We are looking at XRP/USD reversing from the 200-period simple moving average on a 15-minute chart. It provides us with a decent short opportunity towards the interim support. At the same time, placing a stop loss at 0.390-fiat will protect our position from maximum losses should the upside correction resumes.
Having said that, an upside continuation would have us wait for a breakout above the interim resistance. If it happens, we will enter a long position towards 0.402-fiat as our interim upside target while maintaining a stop loss order at 0.393-fiat.
Trade safe!
Disclaimer: The author holds XRP, Bitcoin, Bitcoin Cash, and Ethereum. The analysis above is his personal opinion and does not reflect the opinions of CCN.com. Readers discretion is advised.
Featured Image from Shutterstock. Charts from TradingView.
Get Exclusive Crypto Analysis by Professional Traders and Investors on Hacked.com. Sign up now and get the first month for free. Click here.


