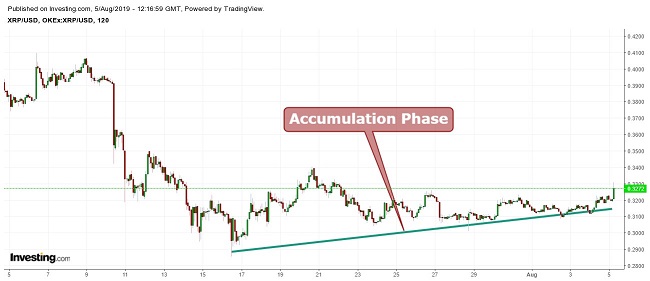
Ripple (XRP)trade is currently trading at $0.3276. When looking at the chart below, we can see that the XRP price has recently broken the resistance level of $0.3232, turning it into support. The next resistance level is at $0.3323.
Although when looking at the bigger picture the price is in a sideways trend, an uptrend will start only after the price closes above $0.350. Taking long position is not suggested at this stage.
Dow Theory
According to Dow Theory, XRP is currently during the accumulation phase. This is the phase during which the asset usually finds its base point, and further decline in the price is less likely. This phase is followed by the participation phase.
Moving Average
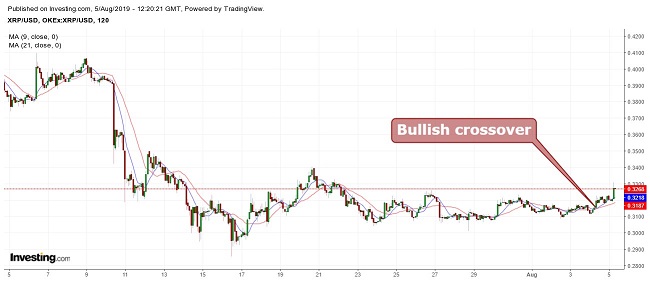
When taking 9 period moving averages (blue) with 21 period moving averages (red), a bullish crossover is seen and the price is moving above the moving average which is a positive signal, indicating that an uptrend might be close.
Bollinger Bands
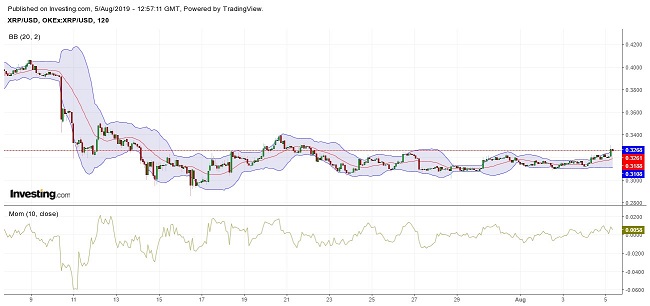
Bollinger Bands show no movement as the digital coin’s price is moving between the channels. The upper limit is acting as resistance and the lower band acting as support. The momentum is also giving no indication to any certain direction.
Therefore, it is suggested to wait until the band expands with a positive momentum; the momentum is on the positive side, indicating that the price could go up after a breakout.
Conclusion
Ripple (XRP)trade is currently trading at $0.3276. Support level is at $0.3232 and resistance level is at $0.3323. Looking at the bigger picture it is recommended not to take long positions at this current price.
It is suggested to wait until the cryptocurrency price closes above $0.350. The midterm target is $0.36. Swing trading can be done using the above-mentioned levels.
Pivot Points
| Name | S3 | S2 | S1 | Pivot Points | R1 | R2 | R3 |
| Classic | 0.2814 | 0.2912 | 0.3036 | 0.3134 | 0.3258 | 0.3356 | 0.3480 |
| Fibonacci | 0.2912 | 0.2997 | 0.3049 | 0.3134 | 0.3219 | 0.3271 | 0.3356 |
| Camarilla | 0.3098 | 0.3118 | 0.3139 | 0.3134 | 0.3179 | 0.3200 | 0.3220 |
| Woodie’s | 0.2826 | 0.2918 | 0.3048 | 0.3140 | 0.3270 | 0.3362 | 0.3492 |
Technical Indicators
| Name | Value | Action |
| RSI(14) | 43.914 | Sell |
| STOCH(9,6) | 22.142 | Sell |
| STOCHRSI(14) | 12.437 | Oversold |
| MACD(12,26) | -0.008 | Sell |
| ADX(14) | 29.534 | Buy |
| Williams %R | -81.278 | Oversold |
| CCI(14) | -75.9932 | Sell |
| ATR(14) | 0.0700 | High Volatility |
| Highs/Lows(14) | -0.0145 | Sell |
| Ultimate Oscillator | 42.713 | Sell |
| ROC | 7.918 | Buy |
| Bull/Bear Power(13) | -0.0613 | Sell |

If You Liked This Article Click To Share