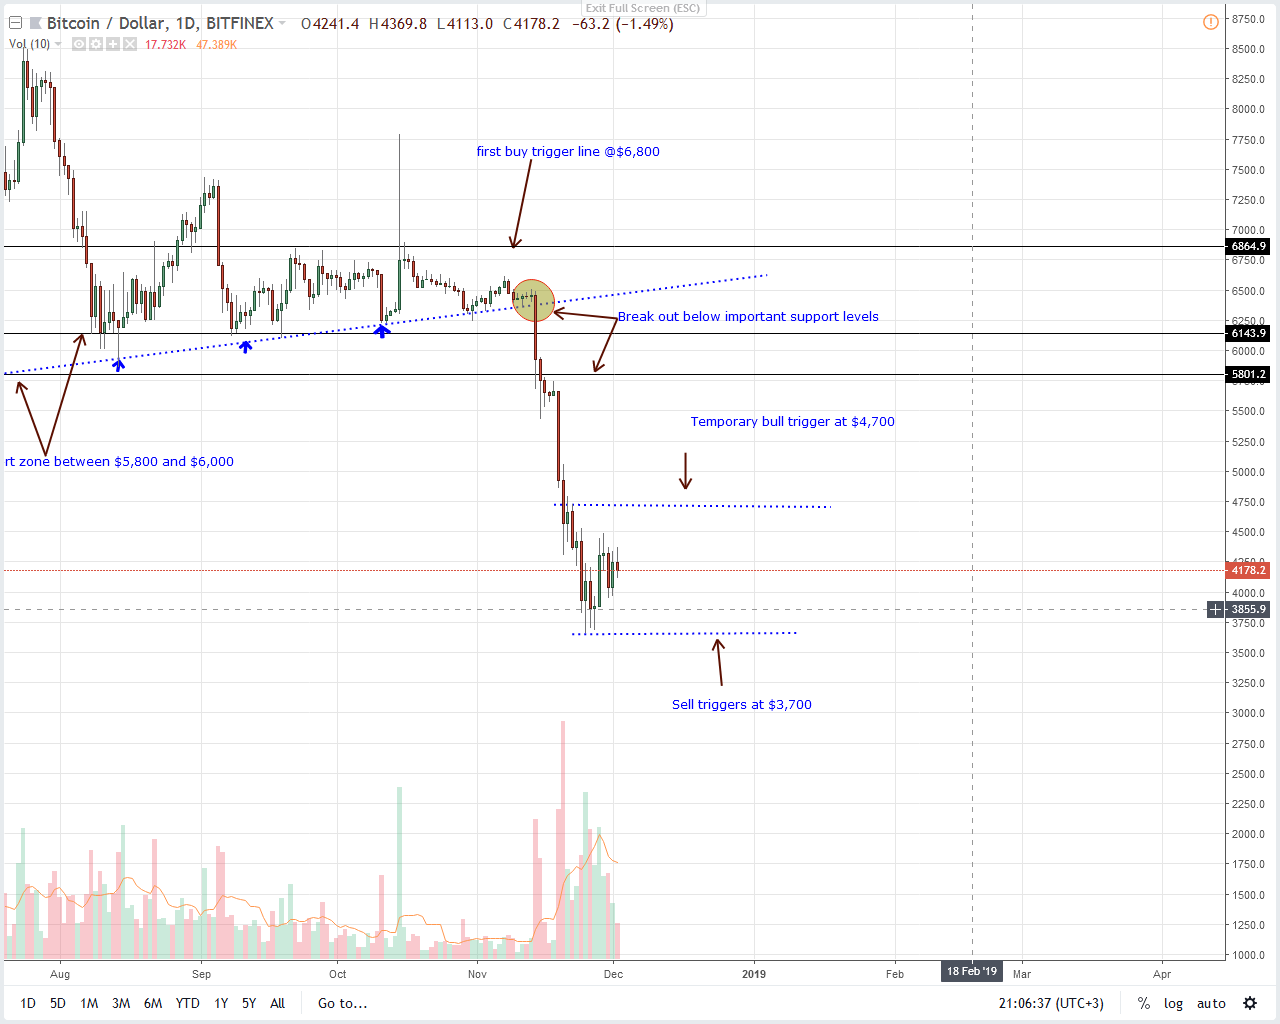
Technically, BTC/USD is bearish but with increasing adoption and an optimistic market expecting entry of institutional grade investors thanks to Fidelity Custodial Services, launch of NASDAQ Bitcoin Futures and a likely approval of Bitcoin ETF by the SEC, digital asset investors are set to gain. However, before traders begin ramping up, prices must first expand above $4,700 and the re-emergence of Satoshi Nakamoto could first track this.
After 8 years Satoshi Nakamoto logged into P2P Foundation group! He posted one word in Arabic which means… “light” What does it mean? And has Satothi’s account been hacked again? pic.twitter.com/Ccubk1vYdM
— Cryptomedics Official (@CryptoMedics) November 30, 2018
Latest Bitcoin News
Still, Bitcoin prices are flip flopping and all over the place. After days of higher highs which culminated with Bitcoin closing higher and unexpectedly fading gains of week ending Nov 25, gains of last week could be the much needed foundation and a sling that will catalyze gains back above$4,700 and eventually $6,000.
Read: Crypto Week In Review: Bitcoin ETF Talk Mounts, Nasdaq To Launch “Crypto 2.0” Futures
But even as bears threaten to press the sell pedal, analysts as Thomas Lee—the Managing Partners and Head of Research at Fundstrat Global Advisors—is overly positive on Bitcoin and the trajectory it will take in the next few years. Citing the digital world where digital assets will find use, he projects BTC prices to expand $300 percent and test $15,000 by the end of the year.
Also Read: November Has Been Bitcoin’s Worst Month for Seven Years
Of course such move will be very positive as far as the ecosystem is concerned. Not only will it steel the network security struggling as miners switch off their rigs leading to drop in hash rate and difficulty but it will buoy investors who have had to contend with steep losses since the collapse began in Q1.
Going forward though, the increasing adoption level, the drop of prices and the consequent “wash” of speculators will be the perfect pad for institutions who investors and influencers as Tim Draper expect to grace the crypto space in 2019 with their “trillions” steadying the market as a result.
BTC/USD Price Analysis
Weekly Chart
After last week’s bar, there is a reason for investors to smile. Well, not only did it end higher—fading losses of week ending Nov 25—at six percent but there was a remarkable spike in market participation. Notice that last week’s volumes despite tight market range was almost twice the average at 304k versus 154k.
A level deeper and this means BTC/USD is finding support despite plummeting prices. Technically, what we would like to see is acceleration above $5,800–$6,000 resistance level for bulls to reassert their presence.
If not and prices sink below $3,700 then we could see further capitulation towards the undesirable $3,000 mark.
Daily Chart
What stand out in this time frame are two bars—Nov 25 and 28 bull bars. These two did fade the general bear trend and are part of the reason why last week ended as bull slowing down losses of week ending Nov 25.
Moving on, we shall take a neutral stand in line with our last BTC/USD trade plan expecting prices to edge higher confirming gains of Nov 28 and the Morning Star Pattern.
Once prices print above $4,700 minor bull trigger line then we might see prices expanding towards our first targets at $5,000 and later $5,800—the lower limit of our resistance zone. Conversely, losses below $3,700 and prices might collapse towards $3,000 as mentioned above.
All Charts Courtesy of Trading View
Disclaimer: Views and opinions expressed are those of the author and aren’t investment advice. Trading of any form involves risk and so do your due diligence before making a trading decision.


