Bitcoin To Revisit $3,700 Before Rally
Earlier this week, Ethereum World News reported that an analyst going by TradingShot claimed that BTC was likely currently overbought. And drastically at that. He claimed that the Relative Strength Index (RSI) reading on the one-day Bitcoin chart sat at 83. Each and every time BTC’s one-day RSI sat perched above 83 in the past, a 30% drop came in the coming days. Case in point, in summer of 2017, BTC fell from $3,000 to $1,700 after its RSI peaked at 84, partially due to a series of China-related news. At the top of the bubble in late-2017, which was when Bitcoin breached $20,000, RSI reached 90, leading to a 47% drawdown in the coming months.
While some cast aside his call, claiming that it was market conditions are different, the trader doubled-down on his analysis in a TradingView chart posted April 9th. In the topical explanation of the chart, TradingShot drew attention to a second reason why a collapse to the $3,800 range is possible. He claimed that in 2015, BTC rallied ~48% from its bottom to pass its 200-day moving average in the accumulation stage of Bitcoin’s market cycle. After that, BTC fell to 17% of its cycle low, before rallying to and past its previous all-time high. While this seems oddly specific, it is important to note that BTC just saw the exact same cycle, but in 2018-2019 rather than 2015. Thus, if this fractal plays out, Bitcoin could fall to 18% of its $3,150 bottom in the coming days (at around $3,700) prior to eventually rebounding.
Not The Only Bear In A Bull Pen
TradingShot isn’t the only short-term bear in this bull pen, so to speak. In a recent edition of Ran NeuNer’s Crypto Trader on CNBC Africa, Richard Heart, a cryptocurrency entrepreneur, explained why he believes that the ongoing rally in BTC likely won’t be extended higher.
Heart told the CNBC host that it would be rather unwise to purchase BTC right now, even for the long haul, explaining that many technicals are still looking overtly bearish. Namely, he took issue with the Relative Strength Index (RSI) readings, which read drastically overbought at 93 on the 12-hour and rather overbought at 85 on the one-day. As explained by TraderShot, such high readings in the indicator have historically led to drawdowns.
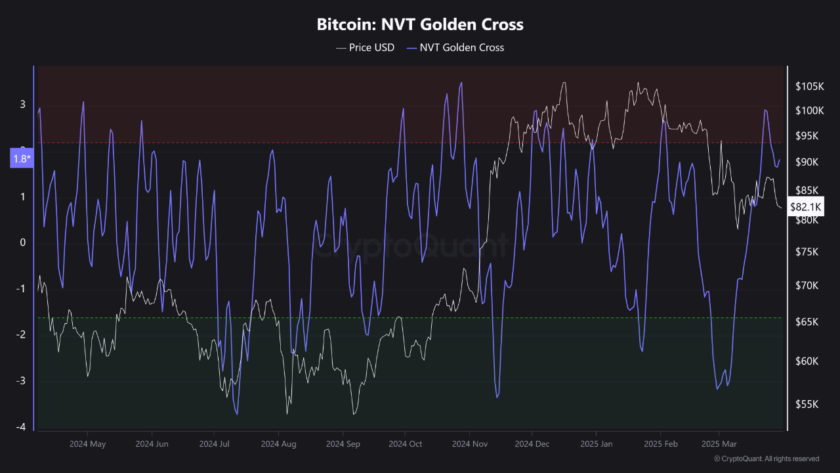
The trader elaborated, remarking that while there have been some bullish crosses in terms of price and important moving averages (the 200-day moving average namely — Tom Lee), there has yet to be a “golden cross” in averages, making it unlikely that a rally could be in Bitcoin’s near-term cards.
This isn’t too say that TradingShot, Richard, and their bear peers are cynical on Bitcoin’s long-term prospects. In the CNBC segment, Heart remarked that if BTC continues its ten-year trend of boom and bust cycles, if you buy the asset now, in three years, you will be up on your money. Shot, seemingly echoed this too, remarking that BTC is currently in the accumulation/distribution stage prior to “the new bull market.”
Photo by Ross Sokolovski on Unsplash


