Marcello Minenna is the director of the quantitative analysis and financial innovation unit in Consob (Italian Companies and Exchange Commission), —Italian government’s authority responsible for regulating the Italian securities market — as well as an adjunct professor of stochastic finance at the London Graduate School of Mathematical Finance and at Luigi Bocconi University of Milan. He is an economic and financial columnist featured on leading Italian and international publications.
The views and opinions expressed here are solely those of the author and do not necessarily reflect the views of Cointelegraph.com.
Sixteen months after from a peak value of $19,100, bitcoin is now hovering around $5,000. Despite its wide distance from the historical maximum, today’s price is good news for the market, as the recent rise could be the end of the collapse produced by the violent explosion of the digital currency bubble in 2018. From December 2017, the price of every digital asset has fallen, on average, 80%; for bitcoin, it has been the second collapse ever recorded, a violent fall even for an unconventional asset that has historically shown very marked boom-and-bust cycles. In 2011, the price declined by 93% — to $2 from a maximum of $39 — while in 2013, in just a few weeks, the price exploded to $1,151 to decline later to $177 over a 12-month period.
It is not certain that, this time, the bottom has been touched, despite the encouraging developments of the last weeks: Historically, the phase of rapid decline is followed by a stagnation of the price that can even last years, named in jargon as a “crypto winter.”
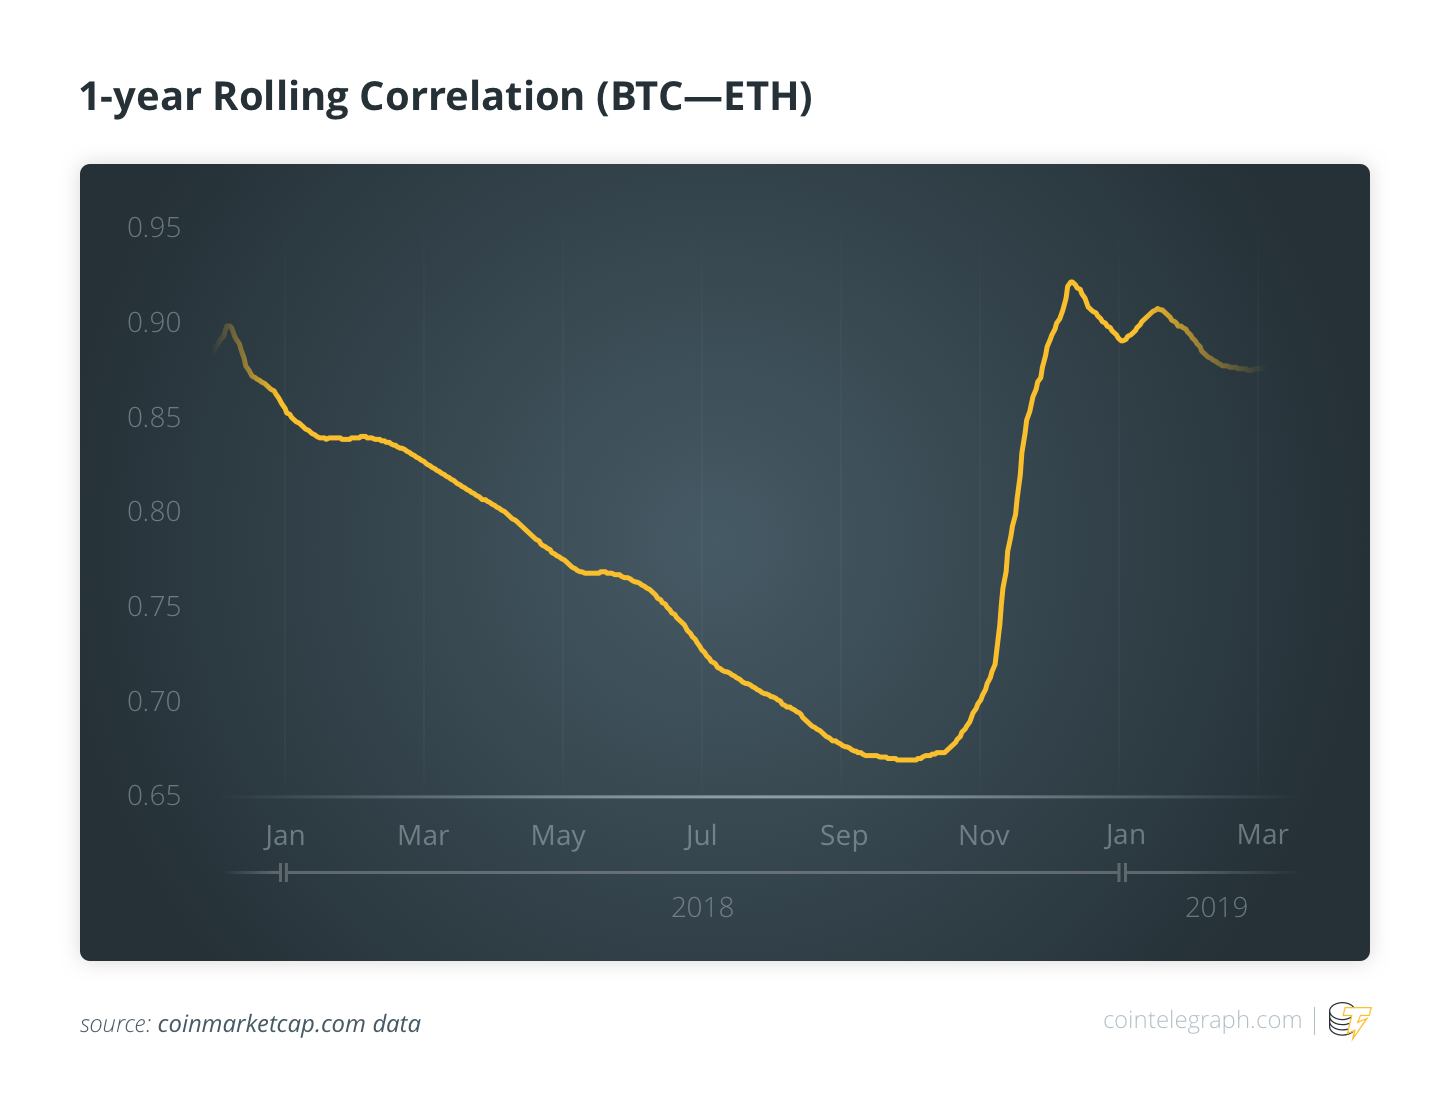
In the context of a widespread speculative bubble that the so-called “altcoins” have turned out to be, apart from any technical evaluation, simple variants more volatile and less liquid than bitcoin, almost perfectly correlated with each other. This feature made any attempt to diversify the risk between different crypto-assets futile.
Among altcoins, a specific mention should go to Ethereum; this is the digital currency classified as second in terms of capitalization that has been exploited as a technical platform for the proliferation of the initial coin offerings (ICOs). These ICOs have been exploited to cover real public purchase offers by collecting financial resources sheltered from regulators and by financing dubiously weak or shady projects. Most of these initiatives have invariably destroyed economic resources or turned out to be real scams in which investors’ defensive capabilities were substantially nullified.
Ex-post, the price pattern during the bitcoin bubble closely followed the asymmetric behavior of its historical cousins, starting with the Tulipan bubble of 1637, passing through that of the South Sea Company up to the most recent burst of the dot-com bubble of 1999-2000.
After a phase of moderate rise, a very rapid manic phase of vertical price growth of about nine months followed, with a final buying hysteria in December 2017 — the month in which the price more than doubled, starting from an already very high base. The summit was touched with a classic “double peak” in January 2018, synchronized — not surprisingly — with the achievement of the maxima on global stock markets and with the peak of liquidity released into the global economy by the main central banks. Since then, the price of bitcoin has had an almost uninterrupted decline, with very rapid collapses, and shorter and less convincing recoveries, with descending relative maxima.
What is the floor of this incredible descent?
On the subject, we must consider that bitcoin, its clones and the rest of the digital currencies do not have their own intrinsic value. Prices are simply determined by the intersection of demand and supply on individual exchange markets; these are often highly illiquid prices, differing from each other by hundreds of euros without effective arbitrage between the various markets due to the structural limits of bitcoin and settlement platforms. Therefore, it is very difficult to think of determining what the fair value could be.
Often for traders operating on these markets, the technical analysis is the only tool for interpreting price movements. This paradoxically means that the price dynamic, determined by the collective actions of the traders, sometimes follows the forecasting patterns of the technical analysis.
Under this overall picture, it is worth trying to isolate the main drivers of the rise and fall of bitcoin and other altcoins. The role played by the stablecoin tether has been predominant in the phase of the rapid price increase between March and December 2017.
A stablecoin is a digital currency anchored with a fixed exchange rate to a fiat currency traded on the forex market, such as the dollar or the euro. Its existence is justified by the fact that, at present, the conversion between fiat and digital currencies is still slow and cumbersome, given that it requires a funds transfer from traditional banks to crypto exchanges via cross-border banks’ payment systems, whose settlement may require several days.
The conversion between digital currencies is instead instantaneous and allows traders to protect themselves by using stablecoins from the very high volatility of bitcoin’s and altcoins’ prices. Of course, 1 tether is not equivalent to $1 because it cannot be freely converted, although the company itself has always declared to hold a reserve of dollars corresponding to the quantity of tether issued and circulating on the exchanges. However, for traders, tether performs the same function of the dollar, so it is irrelevant whether there is or is not full or partial convertibility.
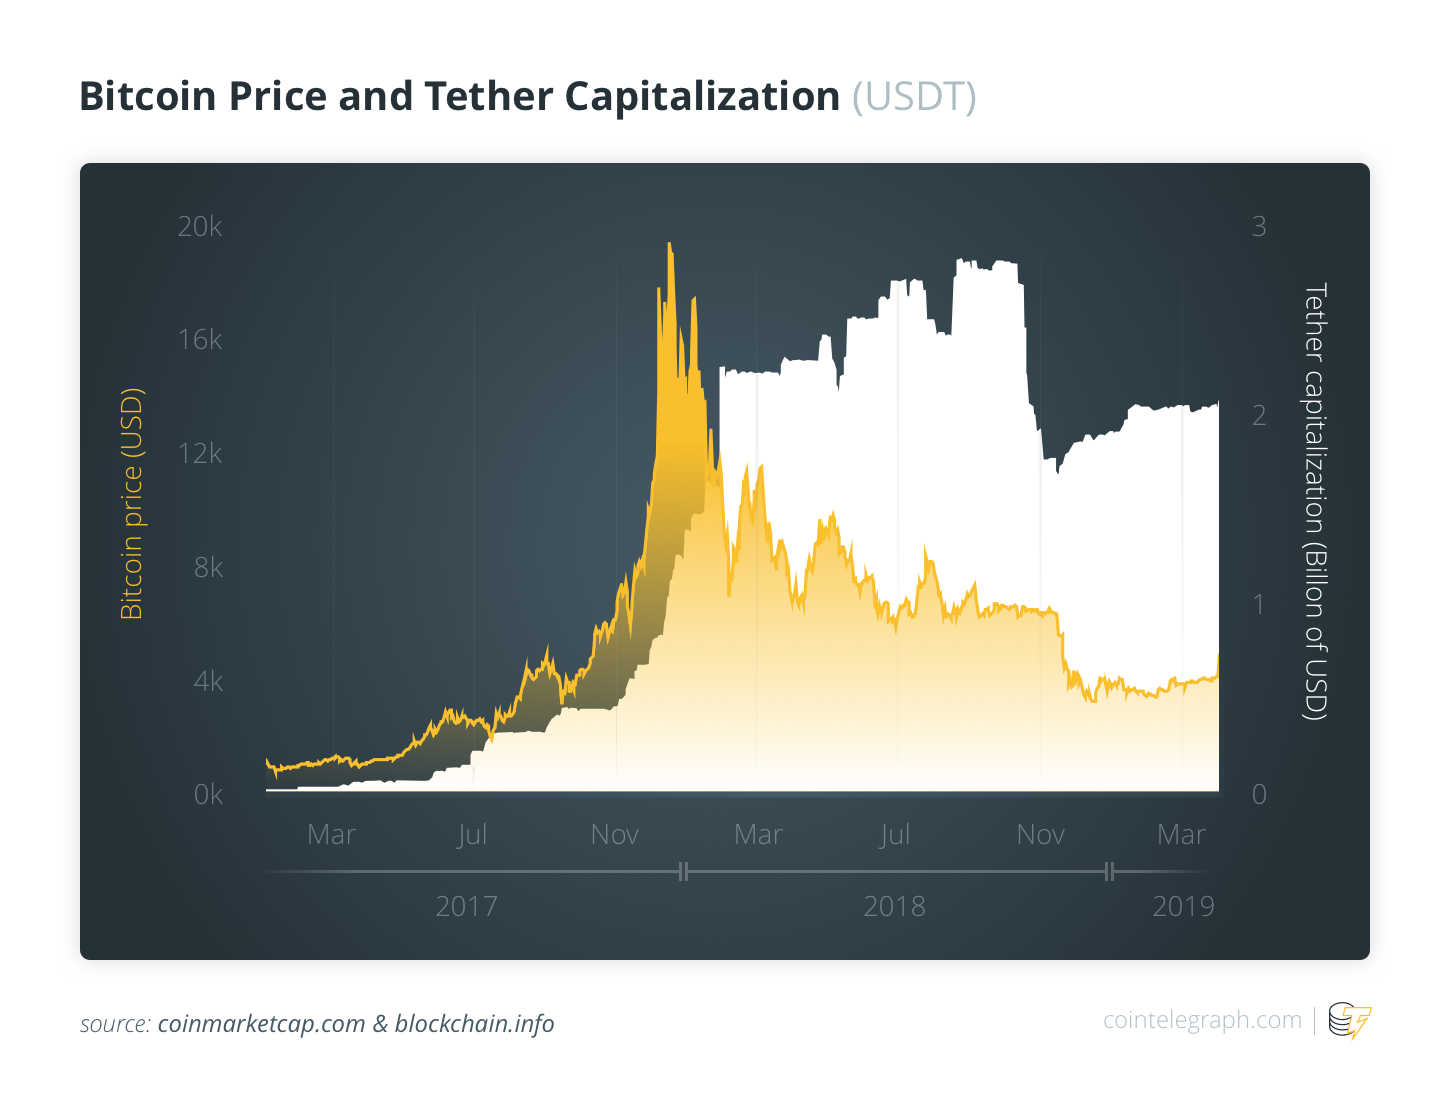
In April 2019, there are at least eight different stablecoins on the market offering the same tether service, but in 2017, tether substantially managed a monopoly that heavily influenced the price trend on the various exchanges, as evidenced by a statistical analysis made by the University of Austin, Texas. What’s happened has a lot to do with the fact that the company that issued tether was de facto controlled by the largest crypto exchange in Asia, Bitfinex.
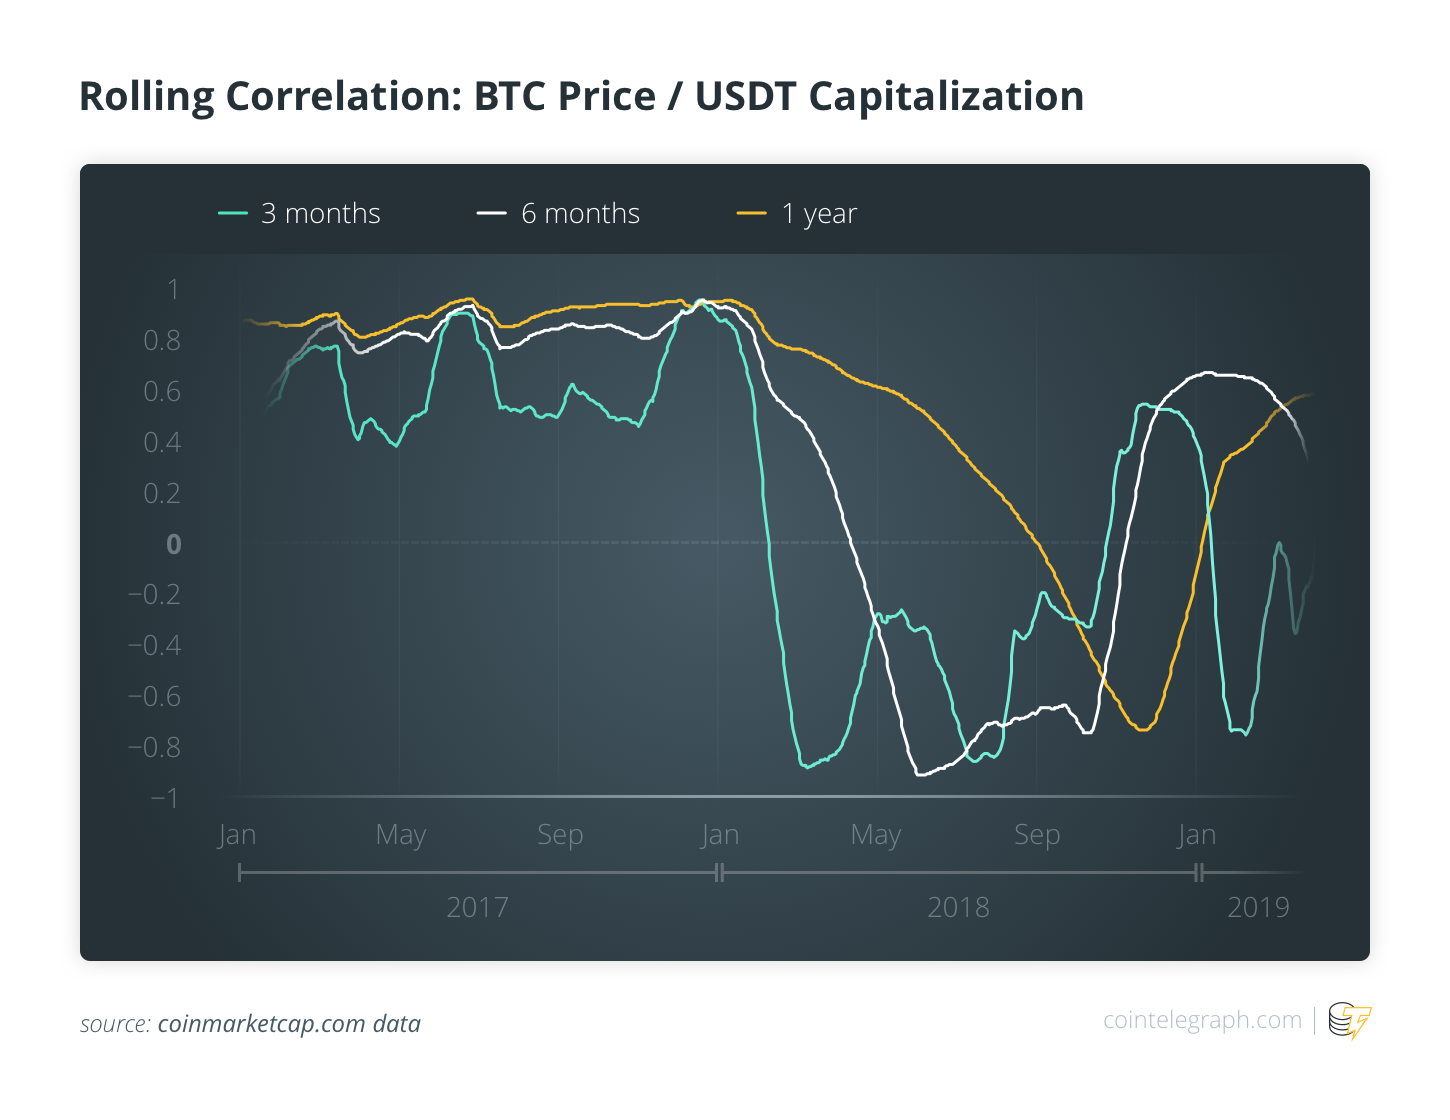
By examining the data (see figures above) we can observe how the price behavior of bitcoin (and of the other altcoins) in the “pump” phase of the bubble is perfectly correlated with the issuing of new tether on the exchanges. As the aforementioned research shows, it is statistically probable that the Bitfinex exchange has artificially fueled the manic buying of digital currencies through the issuing of increasing amounts of tether. In a phase of exponential price rise, the issuing of tether without adequate coverage in dollars is a profitable strategy. In fact, speculators could buy digital currencies with newly minted tether, counting on being able to resell them at a higher price later and replenish the dollar reserves. The signal of strong price increases in increasingly accelerated times contributed to the growth of the media hype on digital currencies, which attracted retail investors with little experience in digital assets, often unaware of the enormous risks related to the terminal phase of a speculative bubble.
The long price contraction, perhaps not yet completed despite the recent recovery in prices, was caused by two main factors operating in two distinct time phases. Between January and April 2018, the decline was demand-driven and therefore determined by the flight of frightened speculative investors, highly exposed to losses due to the purchases made at very high prices. In this classic panic-selling, it can be noted that the support of a growing issue of tether was also lacking on the exchanges. In fact, since February, the growth of tether in circulation has slowed down and flattened out; this is indicative of the fact that, in a declining market, the strategy of issuing uncovered tether was no longer profitable.
In June 2018, the price apparently found a floor at around $6,000, a level still over 10 times greater than the price that bitcoin had at the beginning of 2017. At this point, the majority of speculative investors has already disappeared, and the volatility of digital currencies was drastically reduced as trades gradually became thinner (see figure below). Many analysts believed that, at this stage, $6,000 was the minimum level necessary to offset the energy costs of the miners that were digitally “coining” the new crypto assets. Until then, the need of a widening population of miners to catch cover rising production costs was a force that supported the price growth of digital assets.
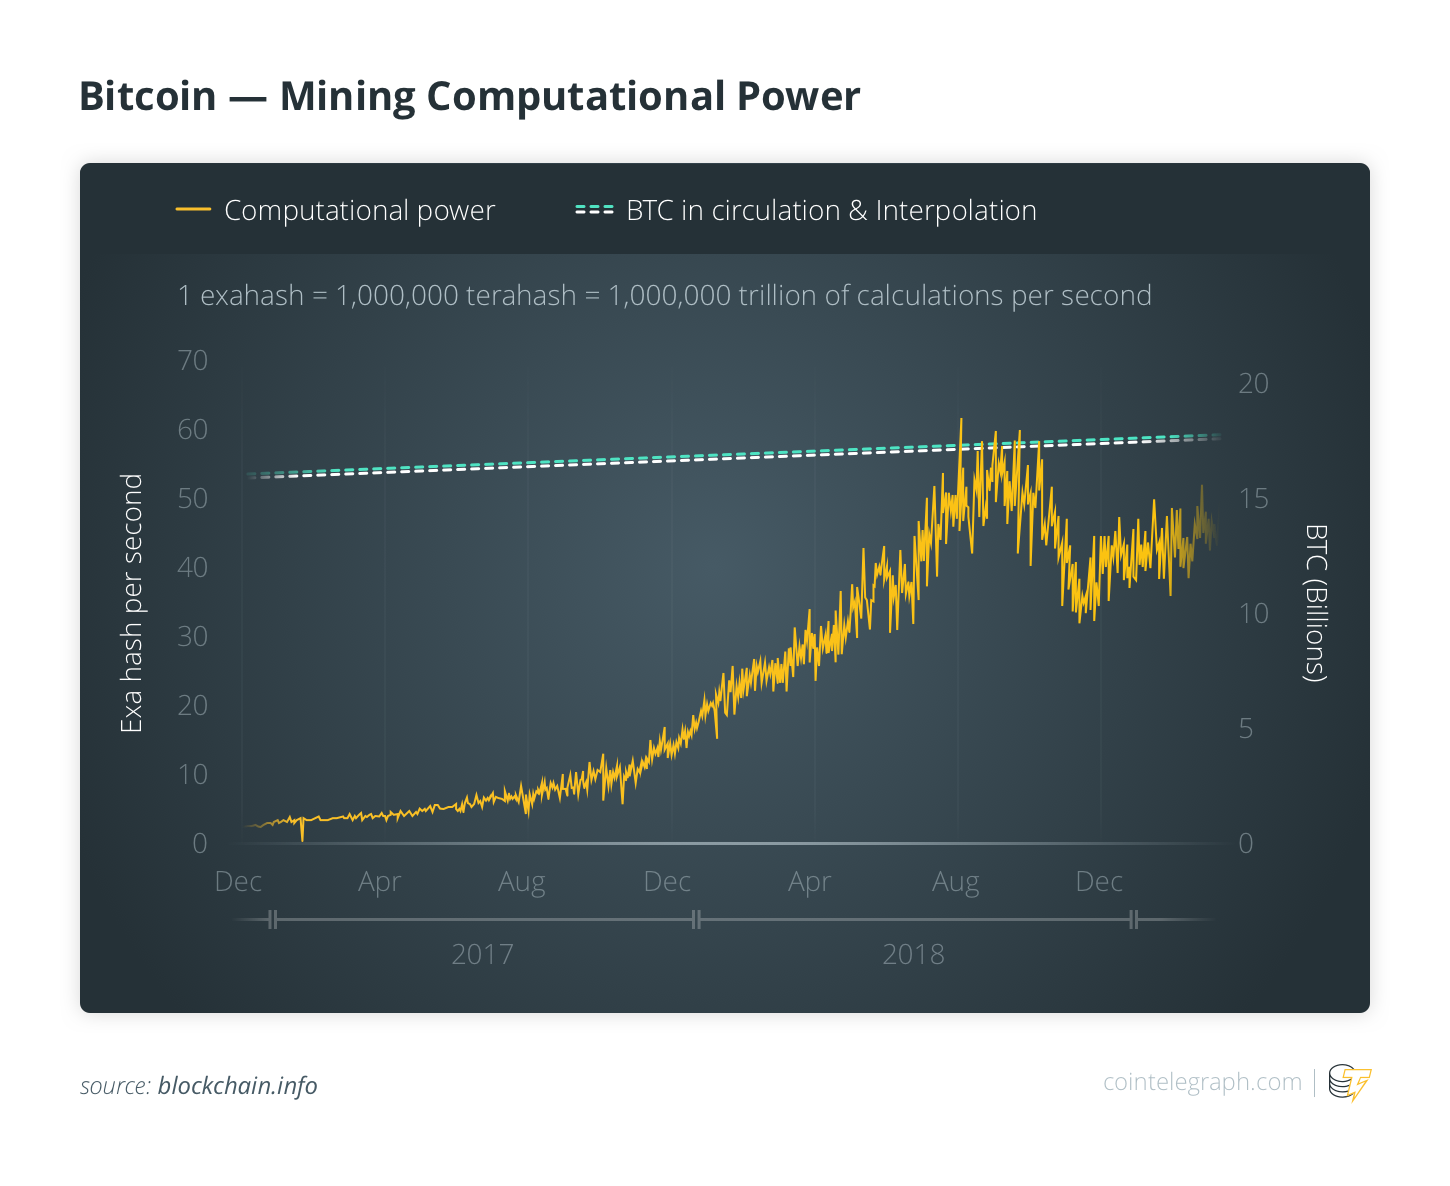
However, this fragile balance did not hold. In November 2018, the announcement of another hard fork between digital currencies that aimed to coin a new bitcoin clone without substantial innovations caused a price earthquake that broke the fragile equilibrium achieved. In this deteriorating framework, the determining factor of the price decline seemed to be offer-driven and related to the digital currencies mining community. In fact, a substantial share of miners abruptly shifted its computing power (or hash rate) from bitcoin toward clone-currencies in the hope to reap risk-free profits from the blockchain fork, as already happened several times in the ascending phase of the bubble.
But at the end of 2018, things were changing: The anomalous shift in computing power took away support for bitcoin and dragged the price of digital assets in a downward spiral, including the clone currencies on which the miners had heavily invested. As a consequence, a part of the miners, which was already operating at a loss before this downturn, has been thrown out of the market, causing — for the first time ever — a decline of the overall computing power of the bitcoin network, which collapsed by 50% in just a few weeks (see figure below). In this short period of time, bitcoin and the altcoins went in a free-fall never experienced in the demand-driven phase of the bursting of the bubble, suffering losses in the order of 70%.
In 2019, the “Darwinian selection” of miners seems to have stopped, as testified by the recovery of the overall network hash rate — albeit at a more moderate rate. The bitcoin protocol provides an automatic mechanism of autoregulation such that the cost of currency’s mining tends to fall in the face of a decline in the network computing power. This periodic adjustment allows marginal operators to return to the market at lower costs.
In the early months of the year, cryptocurrencies slowly regained value, but the real surprise came on April 2, when, in just one hour, bitcoin spiked by almost $1,000, surpassing $5,000 — a new resistance that has basically held up over the weeks since.
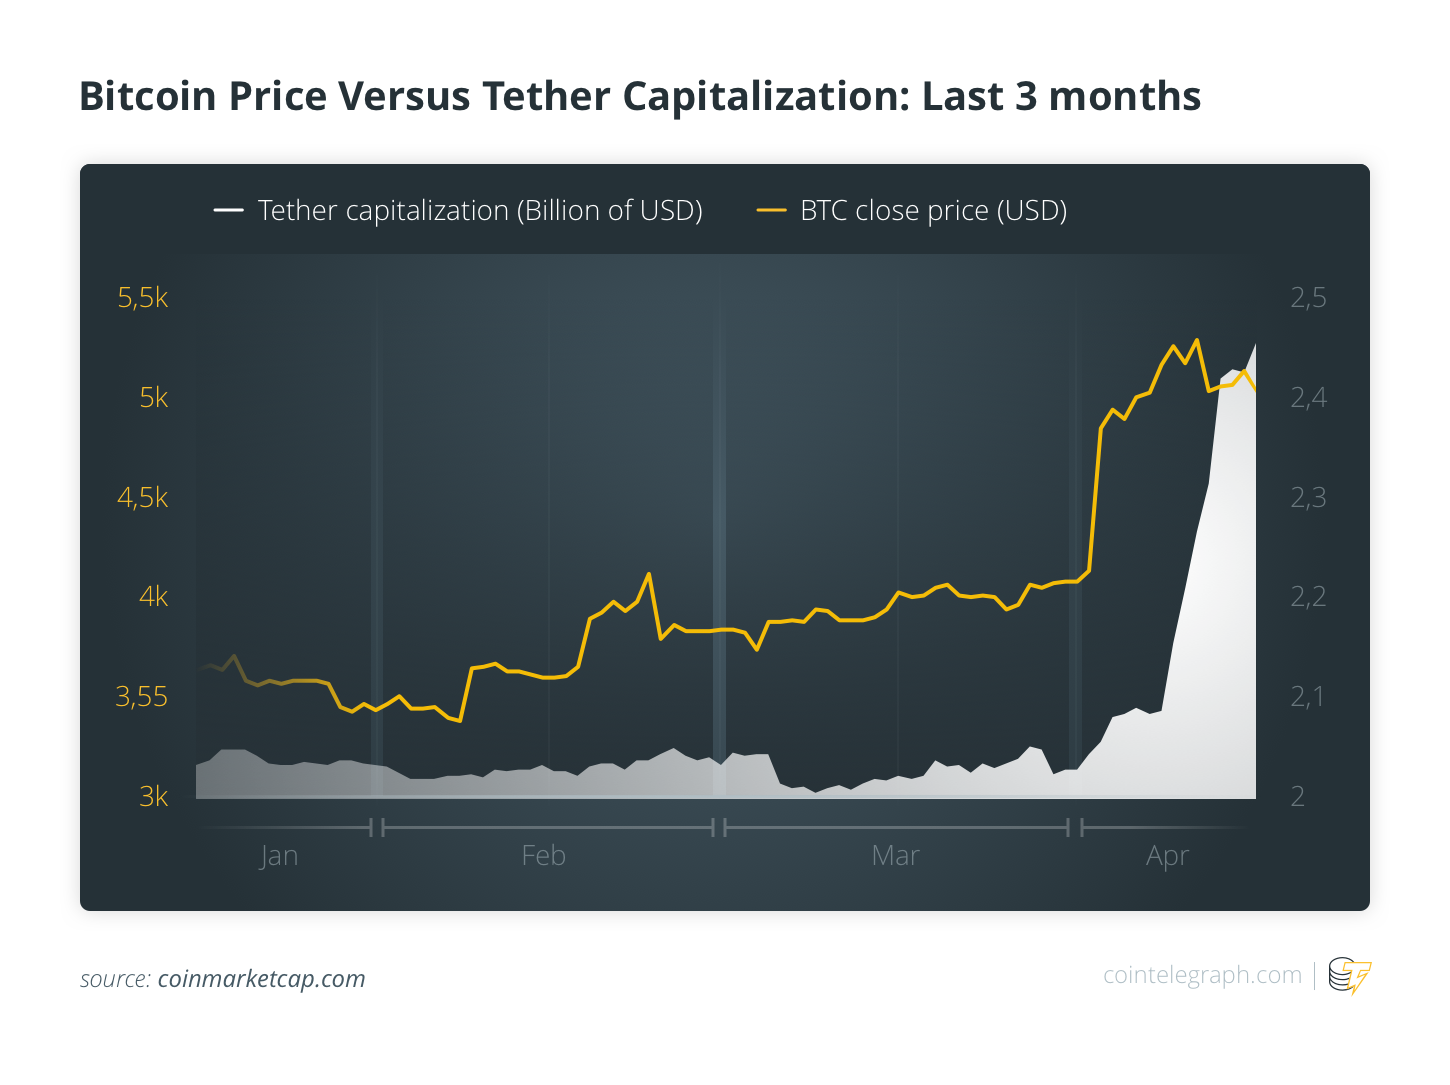
It is not clear what the reason for this jump was (perhaps an algorithmically generated order or a liquidity squeeze connected to bitcoin derivatives followed by a forced buy-in on market makers’ quotes). After all, recently, various analysts had forecast a surge in the short term, and knowing the trigger event matters little. The real question is whether the market is heading back into bull mode. Multiple factors support an affirmative answer: the gradual recovery of the market capitalization of some stablecoins — tether first (see figure below) — the wear of the resources available to the bears, the albeit moderate return of various central banks to an accommodating monetary policy and the uncertainty linked to relevant phenomena on a global scale (the Libyan crisis, trade tensions, the Brexit conundrum and forthcoming European Union elections) that increases the appeal of digital currencies.
2019 could prove to be a new starting point for digital currencies, given the slow recovery of investors’ interest. Investments in technological innovation and infrastructure have never stopped, and the interests of institutional investors go beyond the short-term speculative frenzy. Regulators are also gradually intervening in the reorganization of these frontier markets. The crypto winter may be less long than expected.


