The smart contracts giant kicked off the week on the right foot. Its price has surged over 4.60% since the weekly open to hit a high of $237.5. However, the Tom Demark (TD) Sequential indicator estimates that Ethereum could be bound for a small intraday correction before it continues rising towards the $239 resistance level.
Based on ETH’s 1-hour chart, the TD setup is currently presenting a sell signal in the form of a green nine candlestick. The bearish formation estimates a one to four 1-hour candlesticks correction. A red two candlestick trading below a red one candlestick can serve as confirmation of the pullback.
Ethereum Bound for an Intraday Pullback. (Source: TradingView.com)
Despite the chances of a potential retracement, Ethereum’s network activity is trending up and just reached levels not seen since January 2018.
Ethereum’s Network Activity Explodes
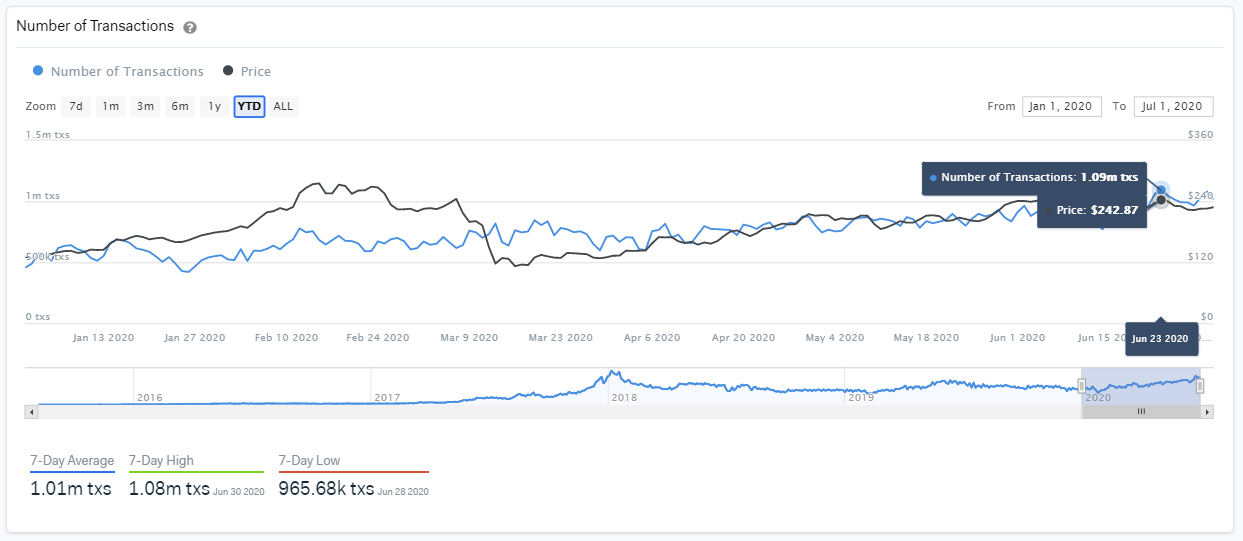
In a recent blog post, Daniel Ferraro, Marketing Director at IntoTheBlock, affirmed that Ethereum is seeing some key on-chain metrics growing exponentially. While prices have increased by nearly 90% year-to-date (YTD), Ether’s utility is expanding over time with more than 1 million transactions on the network registered on a daily basis.
“As yield farming and DeFi activity has boomed the last few weeks, Ethereum has benefitted from an increase in ETH use, which is needed to pay gas costs required by these projects. Recently, the number of Ethereum transactions reached a level not seen since January 2018, it surpassed 1 million transactions, achieving a high of 1.09 million transactions on June 23,” said Ferraro.
The Number of Ethereum Daily Transactions Surges to 2018 Levels. (Source: IntoTheBlock)
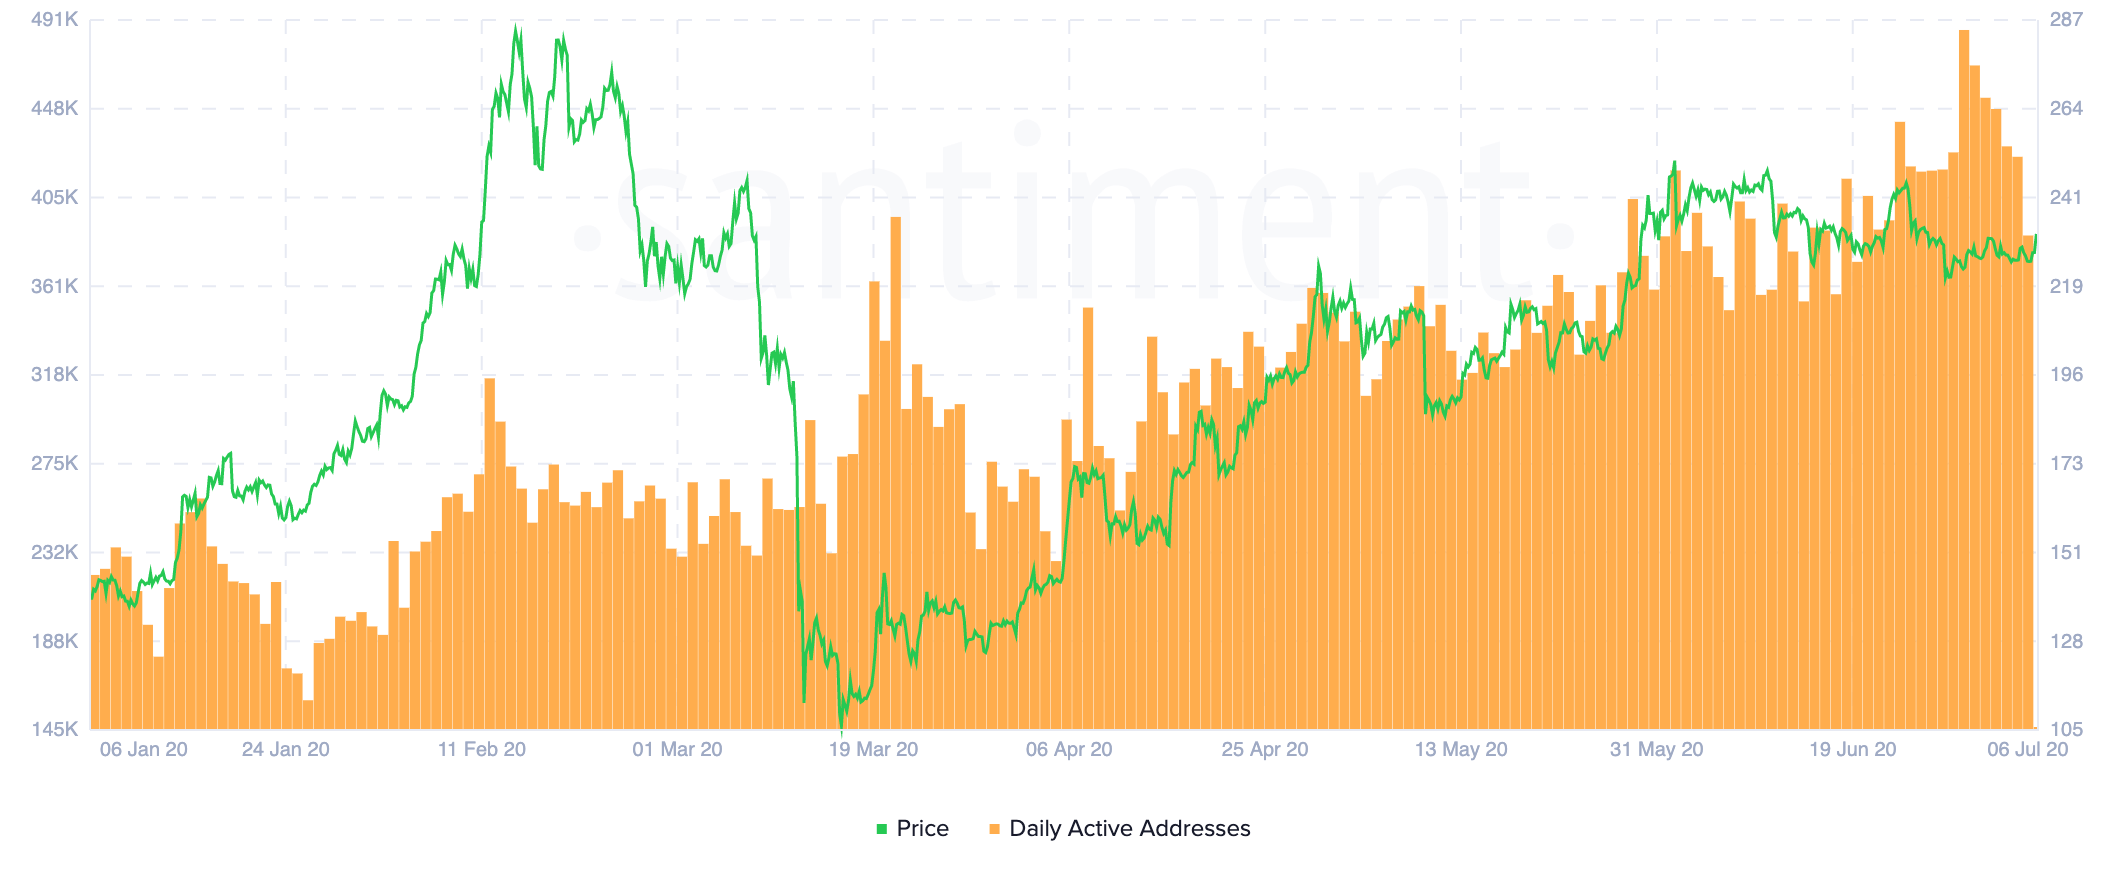
Along the same lines, data from Santiment reveals that the number of daily active ETH addresses surge to nearly 490,000 addresses on June 29. Based on historical data, spikes in daily active addresses have lined up with market tops. Thus, the recent spike could spell trouble for the smart contracts giant.
Ethereum Daily Active Addresses Rise to New Yearly Highs. (Source: Santiment)
Strong Resistance Ahead
A wise man once said, “those who cannot learn from history are doomed to repeat it.” This idea usually can be seen in the price action of different assets and given the high correlation between market tops and daily active addresses, momentum for a bearish impulse could be building up slowly.
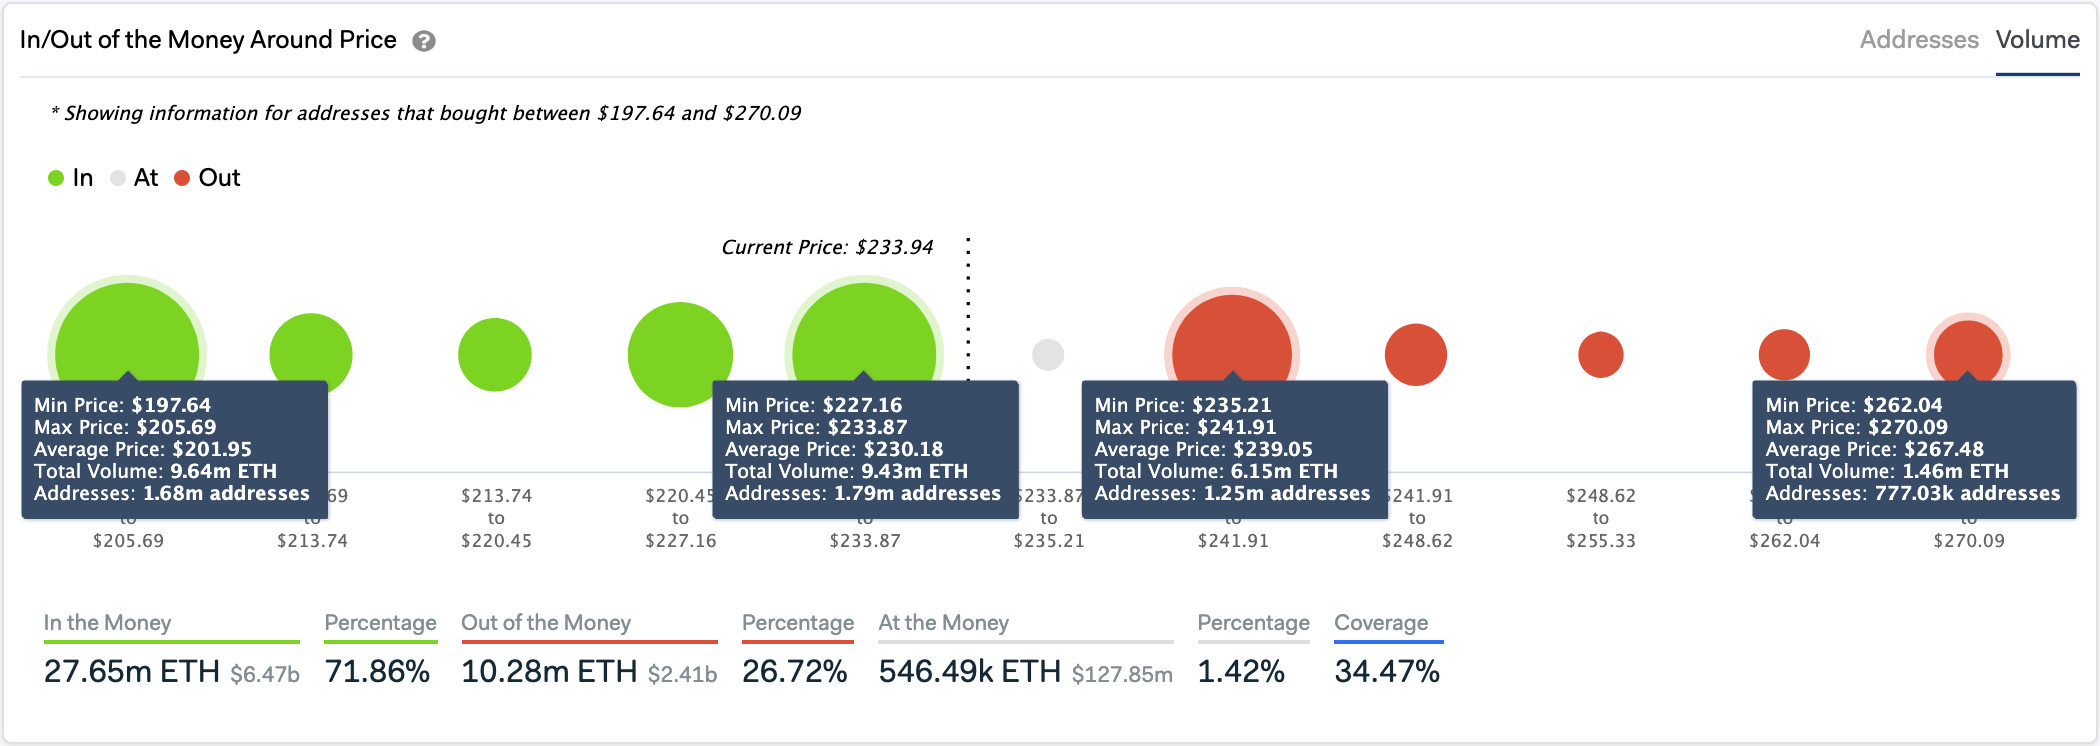
For this reason, investors must watch out for the $239 resistance level. Around this price hurdle, roughly 1.3 million addresses had previously purchased over 6 million ETH, according to IntoTheBlock’s “In/Out of the Money Around Price” (IMOAP) model.
Such a significant supply barrier may prevent Ethereum from advancing further as holders within this range will likely try to break even in the event of a bullish impulse. Under such circumstances, it is reasonable to expect a move back to $230 or $201 support levels based on the price history of the past month.
Key Support and Resistance Levels Ahead of Ethereum. (Source: IntoTheBlock)
It is worth mentioning that a break of the $239 resistance cluster may send Ether towards $270. The IOMAP cohorts show that there is not any considerable supply wall in-between these price points that will prevent such an upswing.
Featured by Shutterstock.
Charts from TradingView.com


