It’s easy to get scared away by the daily volatile movements of bitcoin. Over the weekend, bitcoin jumped 20 percent in a matter of days. Since then, BTC shed over $1,000 before recovering slightly again. It’s a volatile market.
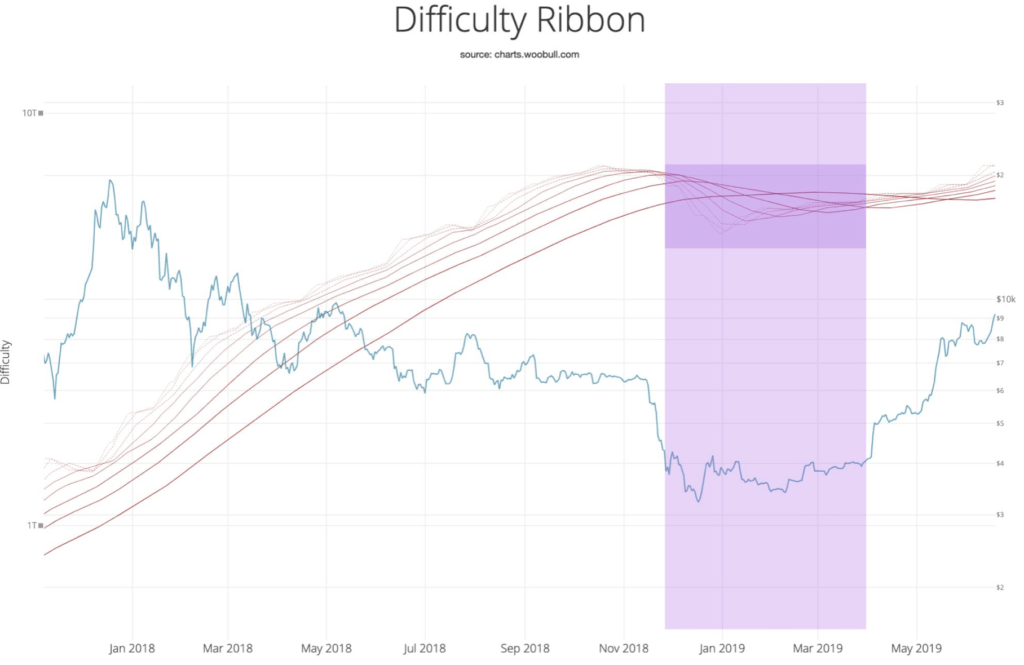
But zoom out for a moment and you’ll see the bigger picture. This chart, shared by on-chain analyst Willy Woo, pinpoints the best windows of opportunity to buy bitcoin for the long term.
Using what’s called the ‘ribbon difficulty’ indicator laid across the long-term logarithmic bitcoin chart, it has historically predicted the best moments to get exposure to bitcoin over the last ten years.
Introducing the Bitcoin Difficulty Ribbon. When the ribbon compresses, or flips negative, these are the best time to buy in and get exposure to Bitcoin. The ribbon consists of simple moving averages on mining difficulty so we can easily see the rate of change in difficulty. pic.twitter.com/6kBz4sLG1d
— Willy Woo (@woonomic) August 1, 2019
So next time you’re about to FOMO into the market, zoom out and take note of this chart.
The best time to buy bitcoin?
According to Willy Woo’s analysis, the perfect moment to accumulate bitcoin is when the difficulty ribbon compresses (gets very thin) or flips negative (when the strong, dark line crosses above the weaker lines), shown below.

The indicator accurately predicted the bottom of the market in late 2018, early 2019. Smart investors should have started accumulating at this point (many hedge funds were).
It’s a data-driven confirmation of a decades-old investment strategy: buy when there’s blood in the streets. In other words, you buy assets when others are fearful, and sell when they’re greedy.
What exactly is the difficulty ribbon?
The ribbon charts moving averages on mining activity, allowing us to visualize the change in bitcoin mining difficulty. It also depicts how bitcoin mining affects the BTC price. As Willy Woo explains:
“As new coins are mined into existence, miners sell some of their mined coins to pay for production costs. This produces bearish price pressure. The weakest miners sell more of their coins to remain operational. When it becomes unsustainable, they capitulate, hashing power and network difficulty reduces (ribbon compression), leaving only the strong, who sell less leaving more room for more bullish price action.”
Miners capitulate in bears, but also during block reward halvening events when suddenly only half the coins are mined for the same costs and the market price has yet to catch up to pay for it. See the compression after each halvening (marked as vertical lines) as miners die off. pic.twitter.com/IwRdpJ4DFt
— Willy Woo (@woonomic) August 1, 2019
Bitcoin remains under $12,000
The ribbon difficulty pattern accurately predicted the recent 200 percent bitcoin price runup. After hitting a high of $13,880, BTC fell back below $10k before mounting another run.
At the time of writing, bitcoin is battling the $12,000 mark in what most analysts see as a healthy pullback. Trader Josh Rager explains:
“Bitcoin is doing okay, needed a pullback day, I’m not remotely bearish as it just needs to [close above] $11k at this time. Right now we’re on our way to closing the highest price weekly candle of 2019 if $11,469 holds.”


