Bitcoin is seeing some intense strength today, with bulls pushing the cryptocurrency towards $17,000 following a brief bout of weakness earlier this week.
The ongoing uptrend has marked a significant extension of the trend seen throughout the past few months, with bears being unable to gain any ground against bulls as it continues pushing higher each week.
The crypto is now trading at the highest prices seen since its 2017 bull run, with it now just a hair away from setting fresh all-time highs.
This comes as retail mania remains tempered, with mainstream media attention and Google Trends activity both showing that the funds driving this trend are coming from non-retail sources.
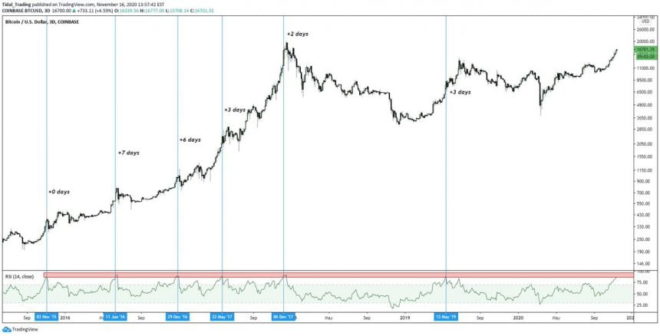
One analyst is now pointing to the benchmark cryptocurrency’s RSI indicator for insights into where it may trend next.
He notes that although BTC’s uptrend shows some signs of being overheated at the moment, there’s still a strong possibility that it will see further upside before facing any selloff.
Typically, when the crypto’s RSI reaches the levels it’s at now, Bitcoin rallies for 3.5 days before seeing a 20%+ pullback.
Bitcoin Rallies Towards $17,000 as Uptrend Continues
At the time of writing, Bitcoin is trading up just over 5% at its current price of $16,800. This marks a massive $1,000 rise from its 24-hour lows set a handful of hours ago.
Where the aggregated market trends in the near-term will likely depend mostly on whether or not BTC can surmount the resistance that exists around $17,000.
If this level is broken above, it may be clear skies up towards the key $20,000 level that investors are closely watching at the moment.
Analyst Claims Indicator Suggests BTC Could Rally Further Before Seeing a Pullback
While sharing his thoughts on where Bitcoin might trend in the near-term, one analyst explained that he is watching its RSI indicator for hints into where it may trend next.
He notes that BTC could rally for a few more days before facing a strong selloff.
“Sure, we’re running hot. That said, the last several times we were at these levels on the 3D RSI we continued higher, on average, for 3.5 more days before any significant pullback (>-20%).”
Image Courtesy of HornHairs. Source: BTCUSD on TradingView.
The coming few days should provide insight into just how far-reaching and sustainable this ongoing Bitcoin upswing will be.
Featured image from Unsplash.
Charts from TradingView.


