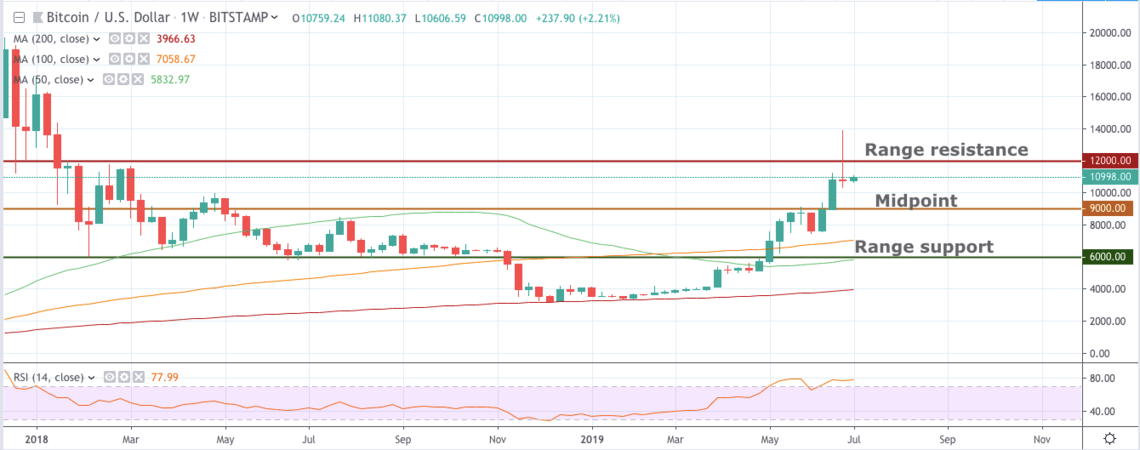
In early May, we accurately predicted that bitcoin would trade above $11,500 before the end of 2019. The leading cryptocurrency breached that level last month, recording a fresh yearly high above $13,000. Since then, BTC has been correcting and is back trading near $10,000.
While many see the retracement as the end of bitcoin’s parabolic rise, our analysis shows that the number one cryptocurrency is simply consolidating gains as those who caught the bottom take profits. However, once this round of selling is over, we are confident that bitcoin will once again trade above $11,500 and rip to a new all-time high at $20,000.
Bitcoin Price Could Sink to $7,400 as Traders Secure Profits
A quick look at bitcoin’s hourly chart tells us that the cryptocurrency is printing a falling wedge. This is a bullish continuation pattern that suggests the resumption of the strong uptrend once profit-taking is over.
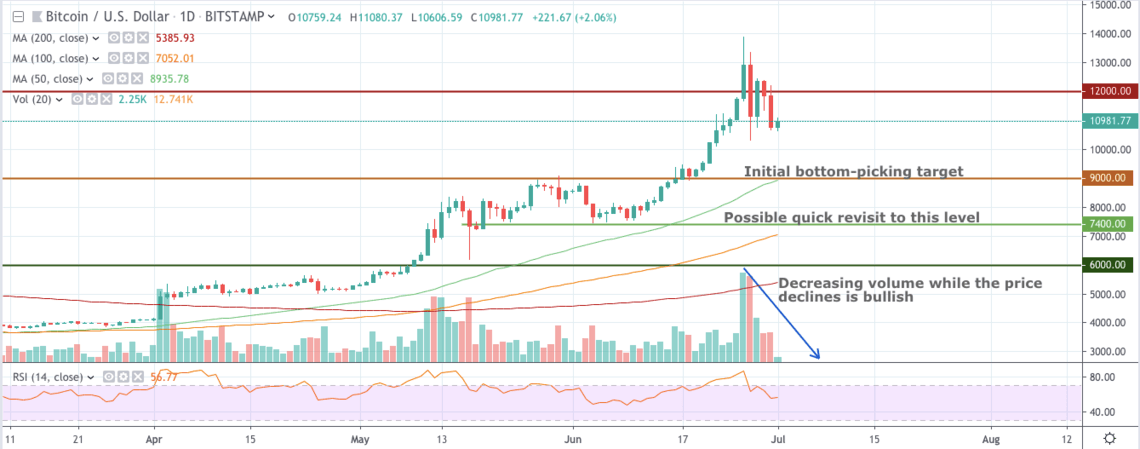
The pattern aligns with our initial bottom-picking price target of $9,000. Support of $9,000 is currently our range midpoint from the macro perspective. At that point, bitcoin would have shed over 35 percent from the 2019 high of $13,880.

However, many traders are also looking at $9,000 to open fresh long positions. Thus, it wouldn’t surprise us if bitcoin pulls off a long squeeze at that level and drops all the way down to support of $7,400.
At that point, technical indicators would have significantly cooled off. More importantly, sentiment would whipsaw to the bearish end of the spectrum, and many would likely predict a subsequent crash toward $6,000. That would be a great setup for a bear trap and a massive short squeeze.

At $7,400, bitcoin would have lost over 46 percent from the yearly high of $13,880. The sharp decline in value would set up the crypto token for a glorious bounce.
Investor Despair Will Set the Stage for Bitcoin’s Next Moon Landing
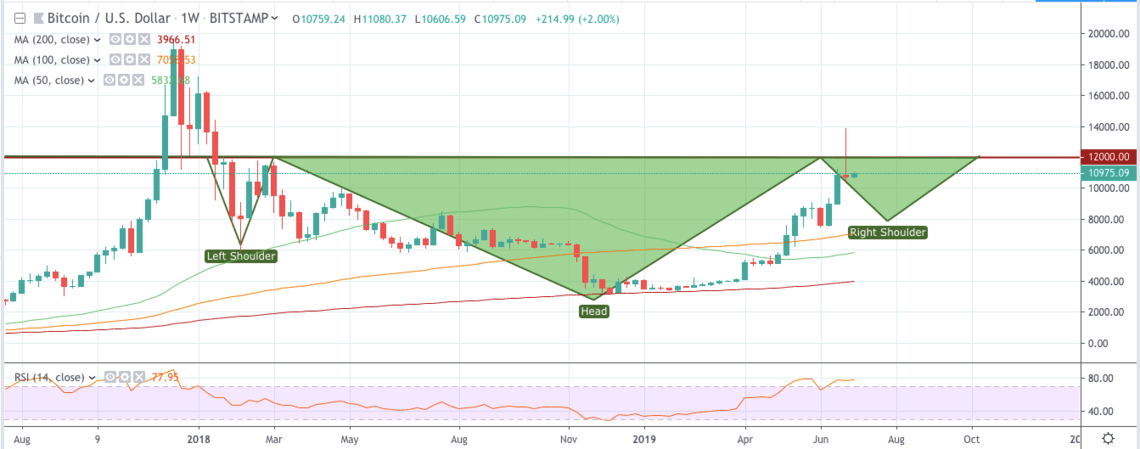
Regardless of whether the first cryptocurrency bounces at $9,000 or $7,000, long-term investors should not worry. Bitcoin is creating a large inverse head-and-shoulders pattern on the weekly chart with a neckline at the $12,000 resistance line.

The formation of this pattern on the weekly chart gives us the conviction that bitcoin would reverse its trend from the long-term perspective in the next couple of months.
A strong move above $12,000 would officially ignite the cryptocurrency’s bull market. Based on the height of the pattern, a breakout would catapult bitcoin above $20,000.
In addition, bitcoin offers no significant resistance above our current range high of $12,000. This strengthens our argument that it would rip to the all-time high of $20,000 once it is done consolidating.
Bottom Line: $20,000 Isn’t a Pipe Dream
Bitcoin is in the midst of a significant correction, and our bottom-picking targets are $9,000 and $7,400.
If bulls hold $7,400, it will be very likely that there will be no stopping the number one cryptocurrency from breaking out of the inverse head-and-shoulders pattern. This is likely to spark a face-melting rally to the all-time high of $20,000.
Thus, this correction could very well be your last chance to buy the dip before the true fireworks begin.
Disclaimer: This article is intended for informational purposes only and should not be taken as investment advice.


