Too Many Unknowns Influencing the Bitcoin Price. Where Could It Go?
November 18, 2019 by Ramiro Burgos
The bitcoin price could test $8,000 USD again before starting a reverse reaction, which could consolidate again on a $10,000 level axis. How likely is that? Well, you’ll have to read our weekly technical analysis and see.
Also read: Bitcoin Price Tour: The Road From $8K to $12K
Bitcoin Price Technical Analysis
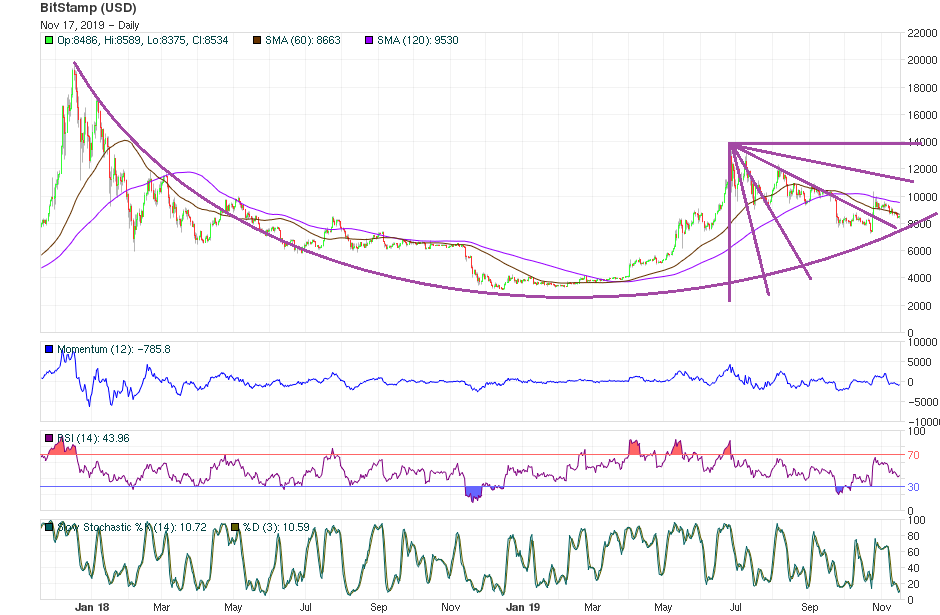
Long-Term Analysis
Following the path of the different developing theories, like Gann’s Angles and Fibonacci s Retracement Numbers, the bitcoin price seems to be heading to $8,000 — where the ascending curve of a Rounded Bottom Formation could gather the General Will for a reversal movement. Considering Gann’s Angles criterion, prices abandoned the bearish channel influence and started touring a 4,000 basis point range between $8,000 and $12,000.
A sensitive psychological trigger level can be analyzed at $9,000, whereas Bullish Consensus turns on and off, depending on the direction of the crossing — increasing volatility and enabling higher or lower technical objectives. According to Mass Psychology Analysis, a Hope phase is still active.
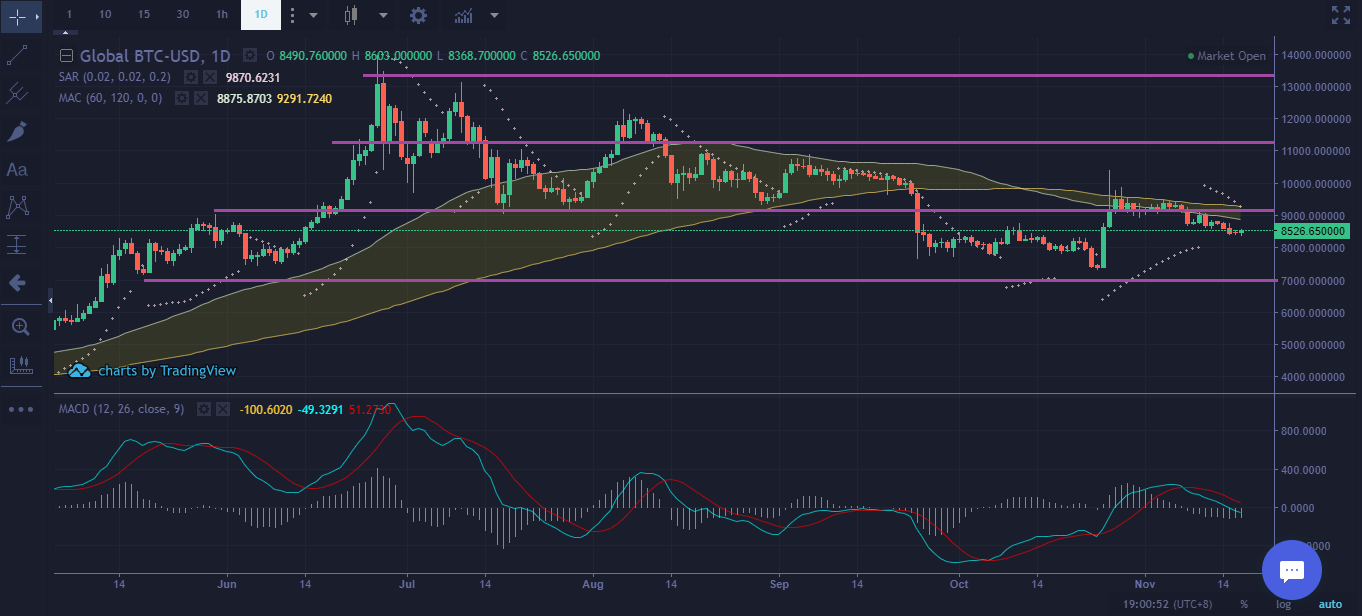
Mid-Term Analysis
Within the current lateral market, mathematical indicators are still going down without tearing down the trend, while quotes keep walking away from bearish channel influence. Prices could test $8,000, where the Rounded Bottom curve defines the lower bound of sideways movement, before starting the march to higher levels, depending on News, Fundamentals and Political factors.
Bullish and bearish formations appear and disappear, melting themselves in the same 4,000 basis point range defined between $8,000 and $12,000, creating an internal zone between $9,000 and $11,000 where prices speed up.
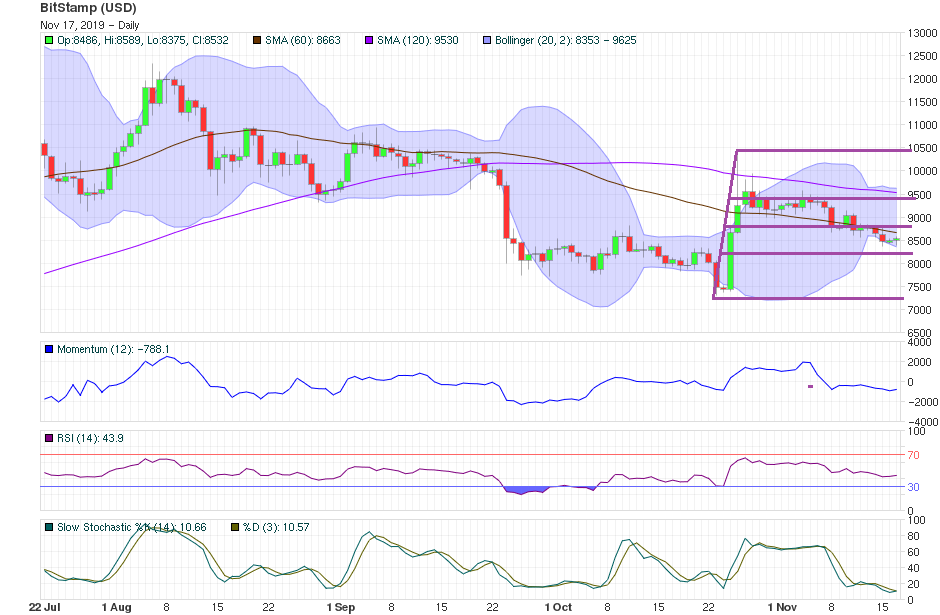
Short-Term Analysis
Japanese Candlesticks’ imaginary battlefield can be settled between $9,000 and $11,000 and Offer’s Crows seem to be in charge, controlling the area by rejecting any of Demand’s soldiers’ attempts to re-enter it. Mathematical indicators need to go down before they can logistically support Soldiers to prevail in battle. All possible reinforcement reasons for a rise seem to be dispersed between $8,000 and $9,000, depending on confusing press releases and conflicting information.
On the other hand, Fibonacci’s nearby scope reflects the possibility of a bounce in $8,000 that, if confirms, could initiate a bullish chain reaction switching up to positive all technical signals and gradually supporting the rise of values to overcome $9,000 on the way to $12,000.
What do you think will happen to the bitcoin price? Share your predictions in the comments below.
If you find Ramiro’s analyses interesting or helpful, you can find out more about how he comes to his conclusions by checking out his primer book, the Manual de Análisis Técnico Aplicado a los Mercados Bursátiles. The text covers the whole range of technical analysis concepts, from introductory to advanced and everything in between. To order, send an email to [email protected]
Images via Pixabay, Ramiro Burgos
This technical analysis is meant for informational purposes only. Bitsonline is not responsible for any gains or losses incurred while trading bitcoin.


