The views and opinions expressed here are solely those of the author and do not necessarily reflect the views of Cointelegraph.com. Every investment and trading move involves risk, you should conduct your own research when making a decision.
The market data is provided by the HitBTC exchange.
Instant messaging service Telegram reportedly plans to launch its Telegram Open Network (TON) in the third quarter of this year. It has created a new programming language called Fift, which will help develop and manage TON blockchain smart contracts and interact with the TON Virtual Machine.
On the other hand, Facebook is allegedly planning to launch its own cryptocurrency in early 2020. The company expects its large user base to start using its cryptocurrency in a dozen countries for making purchases, transferring money and more. Mark Zuckerberg, the founder and chief executive of Facebook, has reportedly discussed the project with U.S. Treasury officials along with Mark Carney, the governor of the Bank of England.
Bitcoin bull Michael Novogratz believes that one of the crypto assets created by the above-mentioned companies is likely to be successful and can even have a “chance to be a real currency.” He also reiterated that the “crypto winter is over” in comments this week. And, according to token rating platform ICObench, the ICO sector is showing a higher success rate as the sentiment improves.
BSV/USD
Bitcoin sv (BSV) was the best performer among the major cryptocurrencies with a rally of above 60% in the past seven days. The boost came amid the news that nChain founder Craig Wright had filed United States copyright registrations for the Bitcoin white paper and the original code used to build Bitcoin. However, the bitcoin community and a few experts do not consider this to be an important event that can alter the fortunes of bitcoin sv. But what do the charts project? Let us find out.
The BSV/USD pair skyrocketed this week and reached the overhead resistance of $134.360. However, profit booking and selling just above this resistance resulted in the pair giving up a large part of its gains. The cryptocurrency should find some support at the current levels, failing which, the drop can extend to $82.489 and lower.
While the sharp up move from the lows shows buying at lower levels, the failure to hold onto the gains shows a lack of demand at higher levels. The pair will pick up momentum on a close (UTC time frame) above $134.360 and will weaken below $38.528. Until then, it is likely to remain range bound between these two levels.
BNB/USD
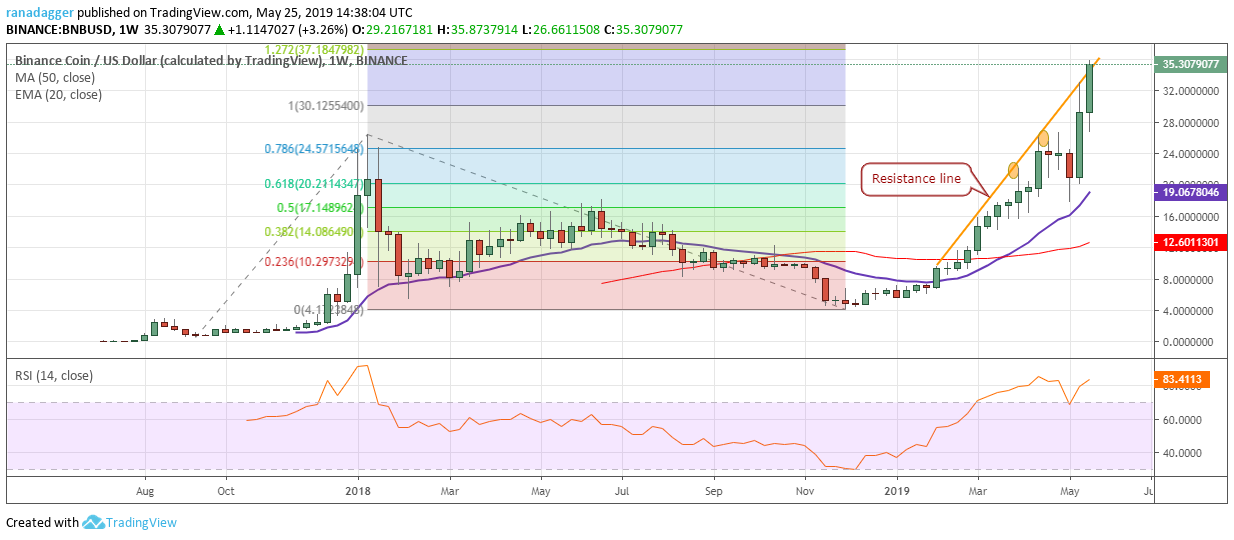
Binance coin (BNB) has been one of the strongest performers among the major coins: it has consistently made new highs and is in a strong uptrend. Riding high on its success, cryptocurrency exchange Binance is reportedly planning to offer margin trading to its clients. The exchange is also giving away $1,000 of $ONE tokens to celebrate the launch of the forthcoming token sale. How far can the rally continue? Let us find out.
The BNB/USD pair is in a strong uptrend and has picked up momentum after breaking out of previous lifetime highs. Earlier, the resistance line had acted as a major roadblock, but the bulls are currently attempting to breakout of it. If successful, the rally can extend to $40 and above it to $46.1645899, which is a 1.618 Fibonacci extension level.
But the rally is getting vertical and the RSI on the weekly charts is threatening to enter deeply overbought territory. This shows that the up move has been overdone in the short-term, and that a minor correction or consolidation can start between $40 and $46.1645899.
LTC/USD
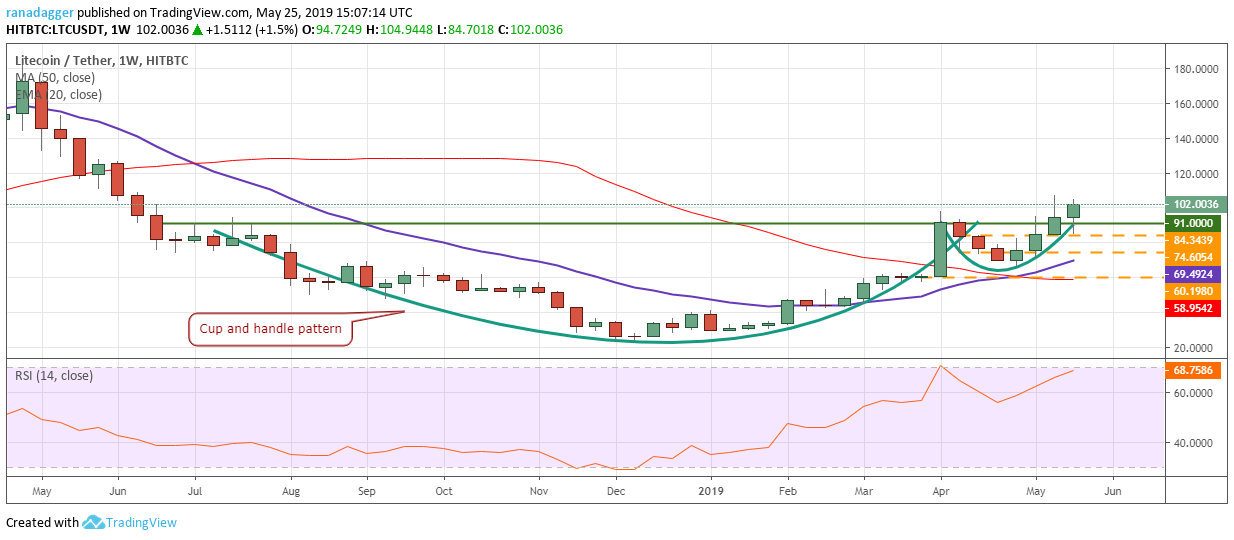
Litecoin (LTC) is benefitting from the positive sentiment in the crypto space, and the forthcoming halving has added to the bullishness. A series of tweets by OKEx pointing to some kind of an announcement regarding Litecoin has also heightened interests. Can the upward move continue?
The LTC/USD pair has completed a cup and handle reversal pattern that has a minimum target objective of $158.81. If the momentum continues, the upward move can extend to $172.647. The moving averages completed a bullish crossover a couple of weeks back and the 20-week EMA is sloping up: this shows that the bulls have the upper hand.
Our bullish view will be invalidated if the cryptocurrency fails to sustain the breakout and dips below the support of $91 once again. The support levels to watch on the downside are $84.3439, $74.6054 and below it to $60.1980.
BCH/USD
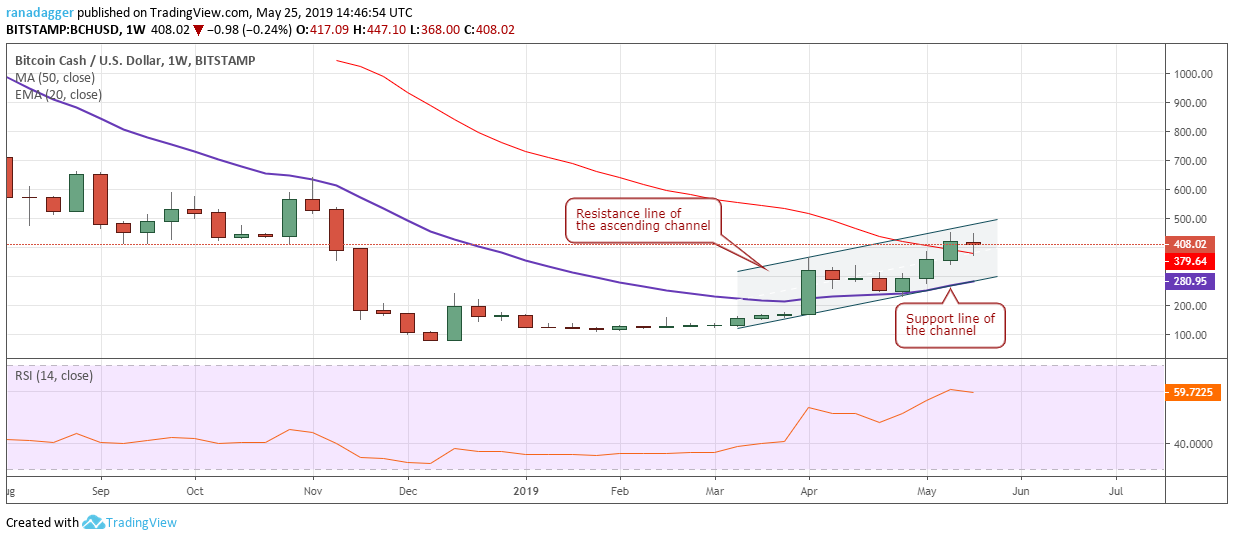
Two miners who control about 43% of the bitcoin cash (BCH) mining pool, BTC.top and BTC.com, joined hands this week and executed a 51% attack to stop an unknown miner from taking coins that were accidentally sent to “anyone can spend” addresses. In this case, the attackers did not carry out the 51% attack for their own benefit, but still some believe that it shows that the cryptocurrency is too centralized. How does its chart look?
The BCH/USD pair is currently rising inside an ascending channel. It has crossed above both the moving averages, which is a positive sign. The bulls are facing selling at the resistance line of the channel, but the positive thing is that the pair has not given up ground. If the price holds above the 50-week SMA, we should see another attempt to breakout of the channel. If successful, a rally to $620 is probable.
On the contrary, if the bulls fail to scale the resistance line of the channel, the digital currency can dip to the support line of the channel, closer to $300. A breakdown of this support will break the trend.
DASH/USD
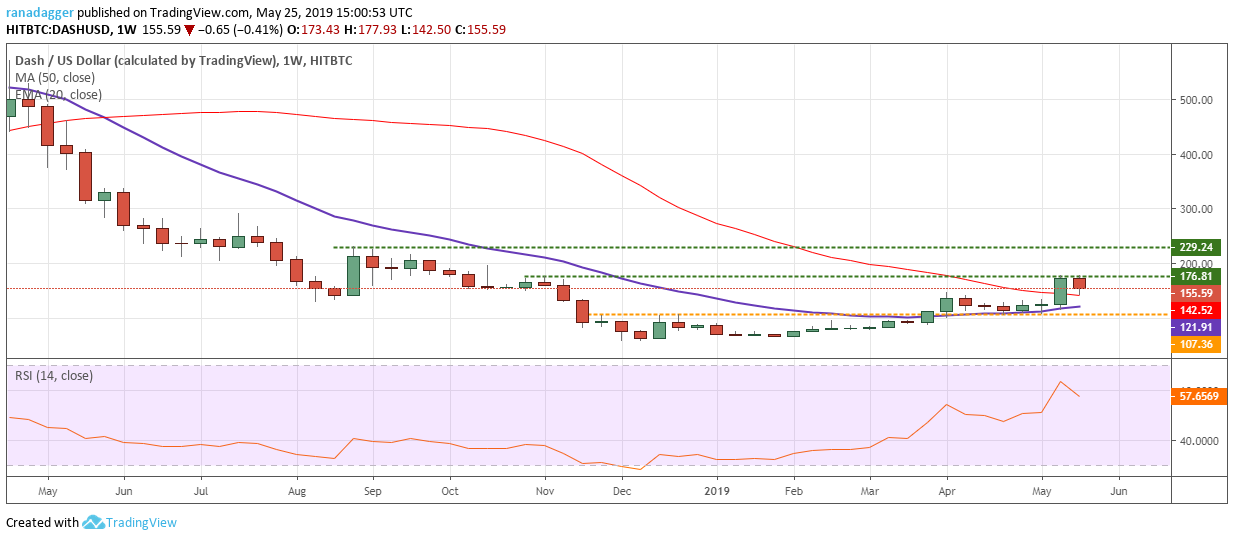
Dash (DASH) released its latest version 0.14 on the mainnet, which is another step leading to version 1.0, dubbed evolution. The upgrade improves the security of the network against 51% mining attacks, the first for proof-of-work networks, according to Dash Core CEO Ryan Taylor. An analysis by Cryptoslate shows that DASH has seen a growth of 58% in the active address count from 2018 to 2019, the largest growth among the major coins. This was reportedly mainly due to the surge in usage in crisis-hit Venezuela.
The DASH/USD pair has been facing resistance at $176.81 since the past week, and a breakout of this barrier will propel the pair to the next level of $229.24. We expect the bulls to again face selling at these levels. Currently, both the moving averages are on the verge of a bullish crossover and the RSI is in the positive territory. This shows that the bulls are at an advantage.
However, if the digital currency turns down from $176.81, it might enter into a consolidation. The support of the range will be at $107.36, and a break of this support will be a bearish sign.
The market data is provided by the HitBTC exchange. Charts for analysis are provided by TradingView.

