Large-cap altcoins are attempting to rally higher but first bulls need to flip $24,000 to support.
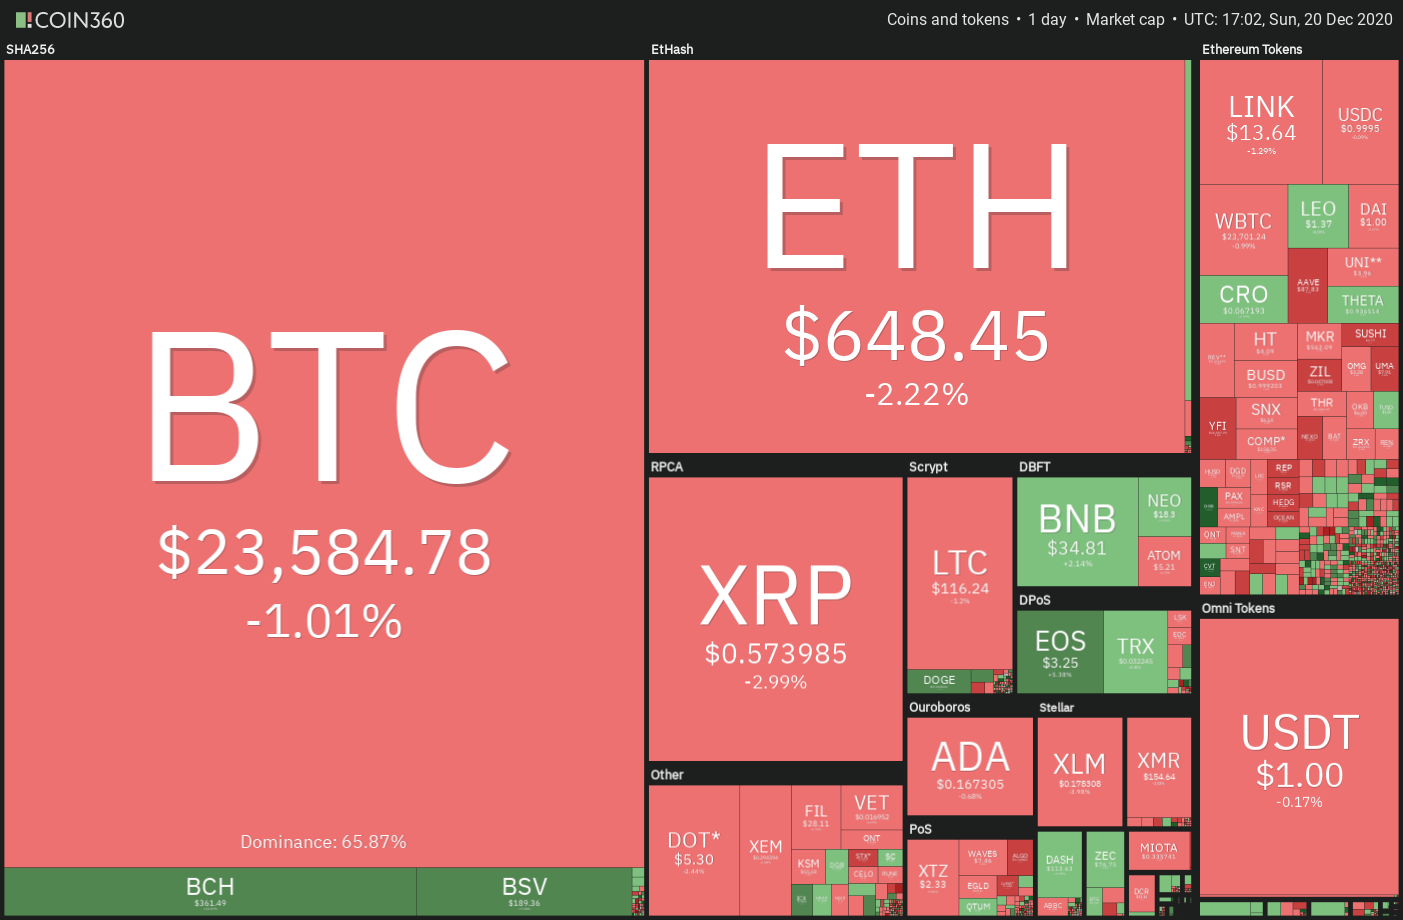
When the price of an asset hits a new all-time high, momentum traders plow in as they sense an opportunity to ride the trade higher. The same was seen after Bitcoin (BTC) price broke above the $20,000 mark on Dec. 16. By Dec. 19, the price had hit an intraday high at $24,197.46, a 21% rally in four days.
These sharp moves in Bitcoin price attract traders who use derivatives to try and amplify their gains or hedge their existing positions by buying downside protection. This resulted in the open interest on Bitcoin options hitting a new all-time high at $6.5 billion earlier this week.
While professional traders use complicated options strategies to establish their positions, the retail traders generally buy naked options with a dream of earning a windfall on the options contract. This can be seen from the high open interest on the $36,000 strike price and the $52,000 call option.
For every option contract, there is a seller and a buyer and generally, professional traders prefer to sell the option contracts and pocket the premium when the expiry is worthless. Therefore, retail traders should make informed decisions before buying naked options contracts.
The bullish momentum on Bitcoin has pulled select altcoins higher. Let’s look at the charts of top-5 cryptocurrencies that could offer trading opportunities in the coming week.
BTC/USD
Bitcoin picked up momentum after the price broke above the $20,000 overhead resistance but the quick rise of the past few days has pushed the relative strength index (RSI) deep into the overbought territory. This suggests the possibility of a consolidation or a correction in the next few days.
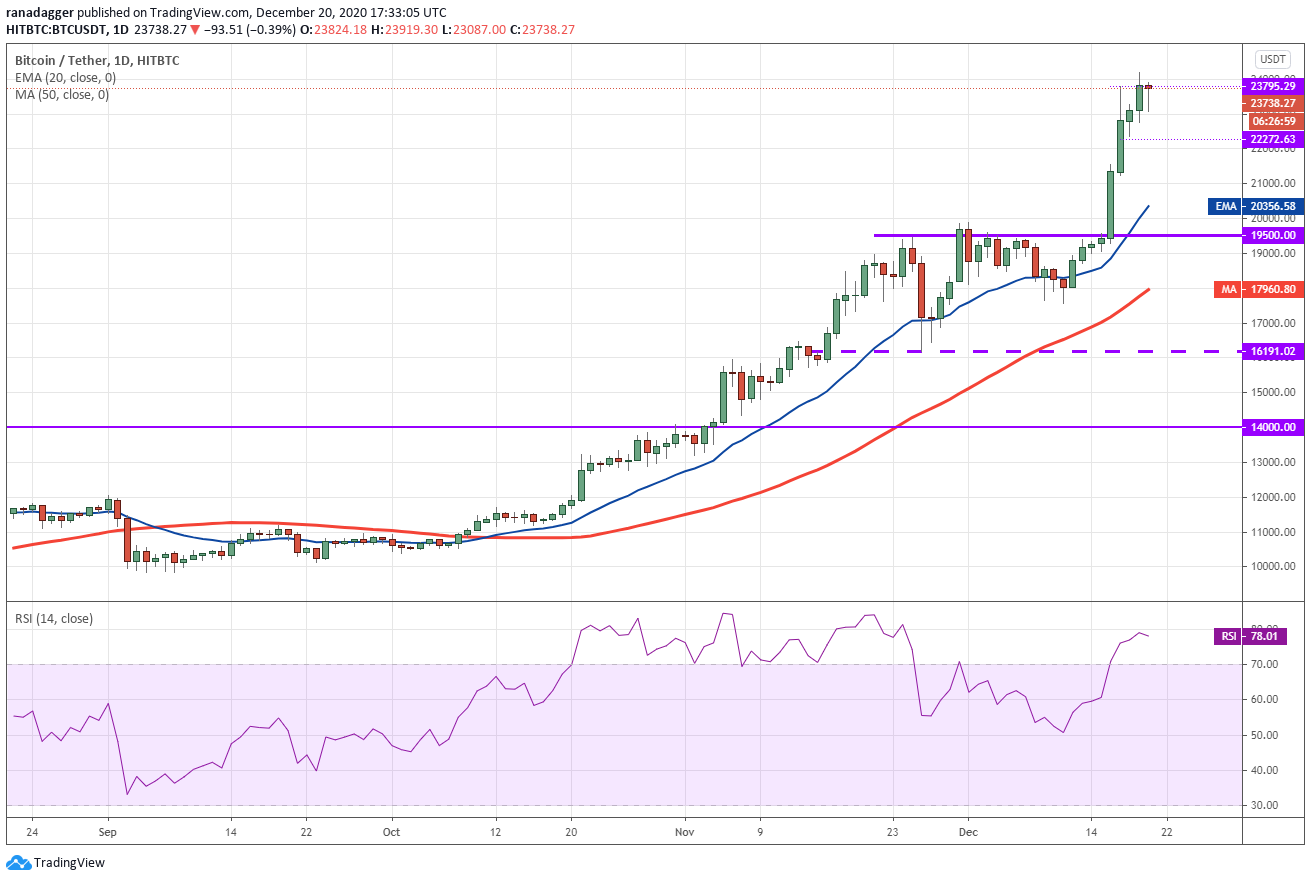
Usually, after the price breaks above a critical level such as an all-time high, it turns down and retests the breakout level. In this case, the BTC/USD pair may turn down from the $25,000 to $26,000 resistance zone and retest the breakout level at $20,000.
If the price rebounds off this support aggressively, the bulls will again try to resume the uptrend. If they succeed, it will suggest that $20,000 is the new floor for the pair.
Contrary to this assumption, if the bears sink the price below the 20-day exponential moving average ($20,356) and the $19,500 support, the pair may drop to the 50-day simple moving average at $17,960.
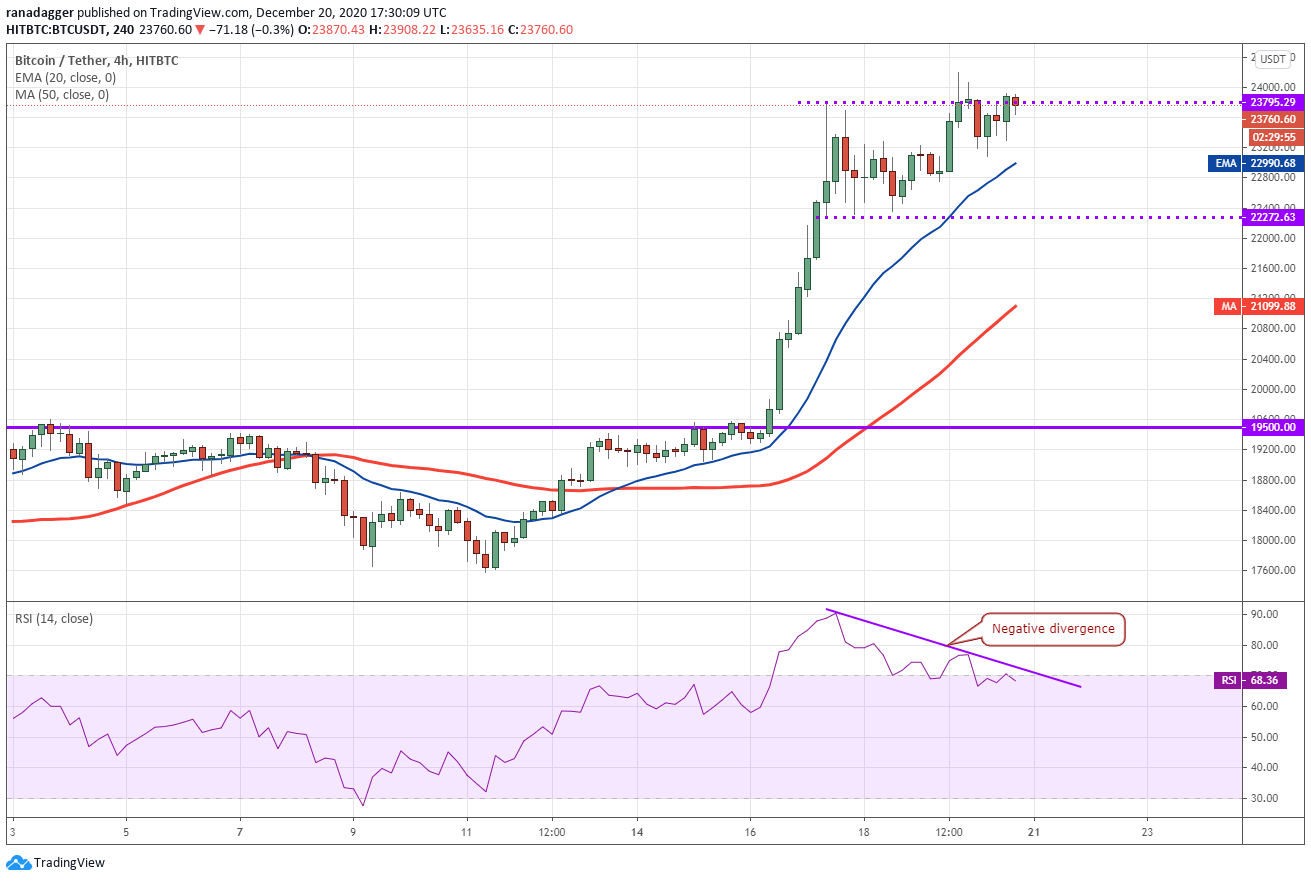
Although the trend is up, the 4-hour chart shows that the bulls are finding it difficult to sustain the price above $23,795.29. This suggests that after the recent sharp up-move, the bears are attempting to stall the rally. The negative divergence on the RSI is a signal that the momentum may be weakening.
If the price dips below the 20-EMA, the pair could drop to the $22,272.63 support. This is an important short-term level to watch out for because if it cracks, the short-term traders may book profits. That could quickly pull the price down to the 50-SMA and then to $20,000.
This view will be invalidated if the price surges and sustains above $24,000. Such a move will suggest that momentum traders are in control.
ETH/USD
Ether (ETH) broke out of the ascending triangle pattern on Dec. 16 and the price rallied to $676.325 on Dec. 17 but the bulls could not sustain the higher levels as seen from the long wick on the daily candlestick.
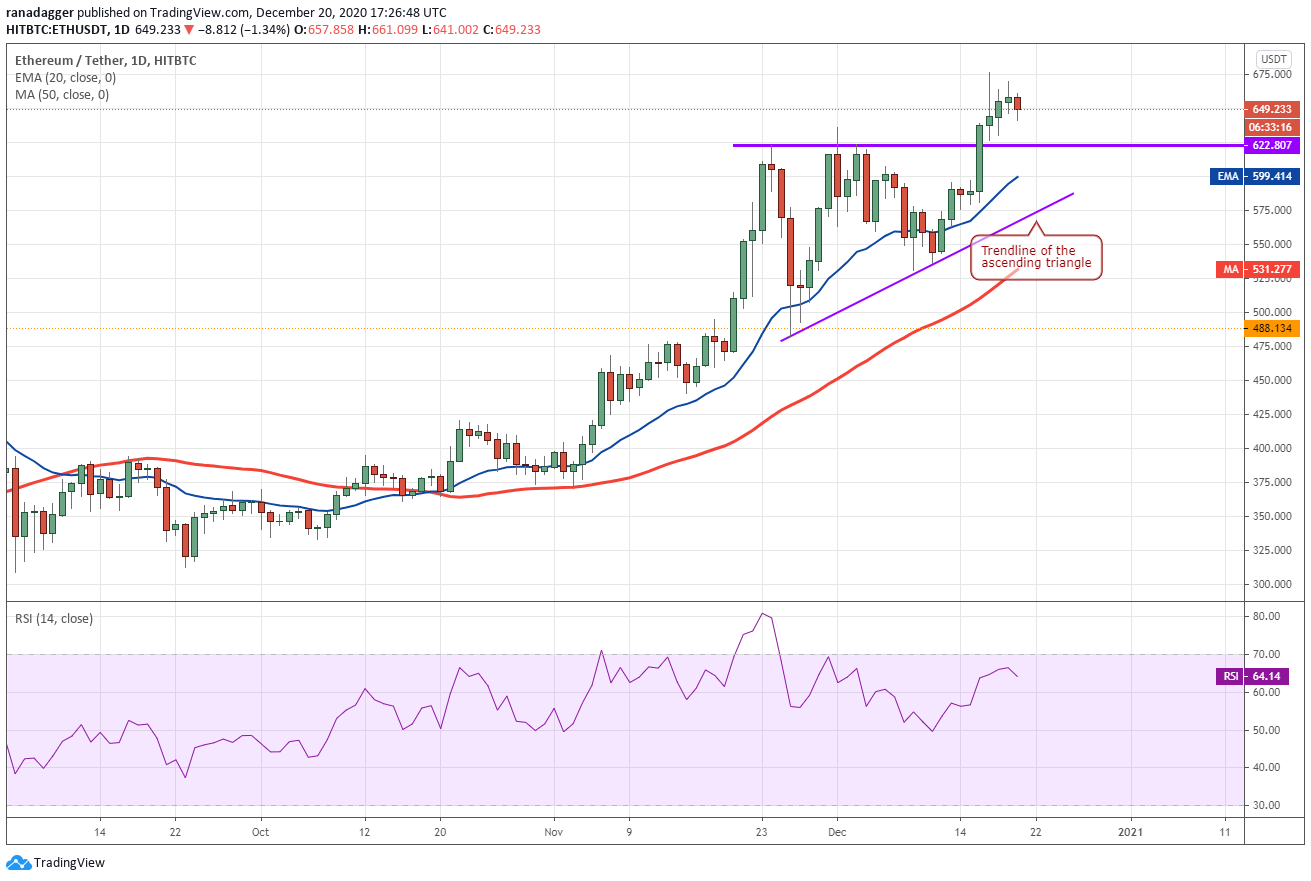
However, a positive is that the bulls have not allowed the price to drop below the immediate support at $622.807. The price is currently stuck between $622.807 and $676.325.
If the bulls can propel the price above $676.325, it could start the next leg of the uptrend that could reach the pattern target of $763.614. The upsloping moving averages suggest that the bulls have the upper hand.
Conversely, if the bears sink the price below $622.807, the ETH/USD pair could drop to the 20-day EMA ($599). If the price rebounds off this support with strength, the bulls will try to resume the uptrend.
The trend will turn in favor of the bears if the price drops below the trendline of the triangle.
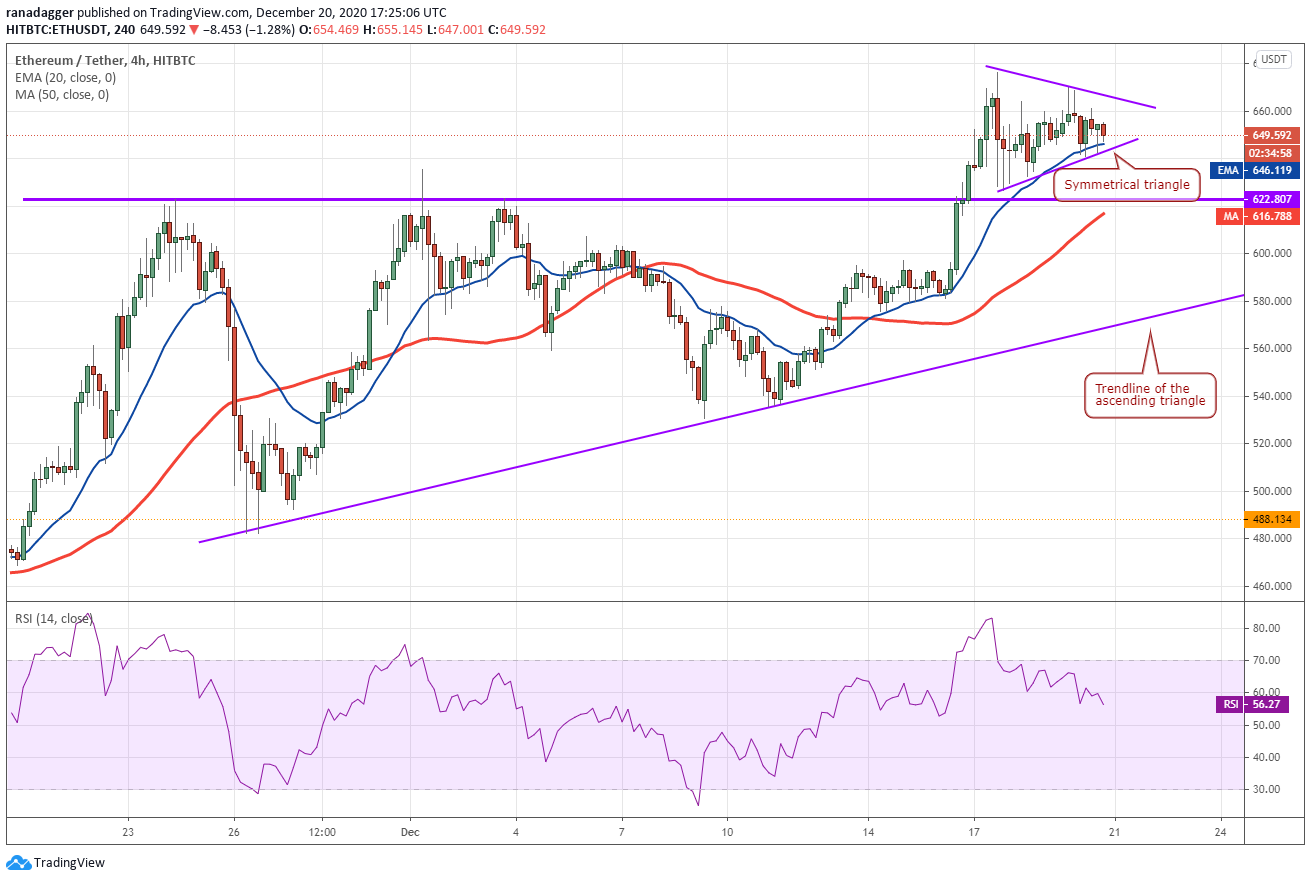
The 4-hour chart shows a symmetrical triangle formation, which generally acts as a continuation pattern. If the bulls can push the price above the triangle, the pair may resume the uptrend.
On the contrary, if the price dips below the triangle, a drop to the $622.807 support is possible. If the bears sink the price below the 50-SMA, the pair may lose momentum and drop to the trendline of the triangle.
LTC/USD
Litecoin (LTC) picked up momentum after breaking out of the symmetrical triangle on Dec. 16. The target objective of the breakout from the triangle was $119.77 and that was hit on Dec. 19.
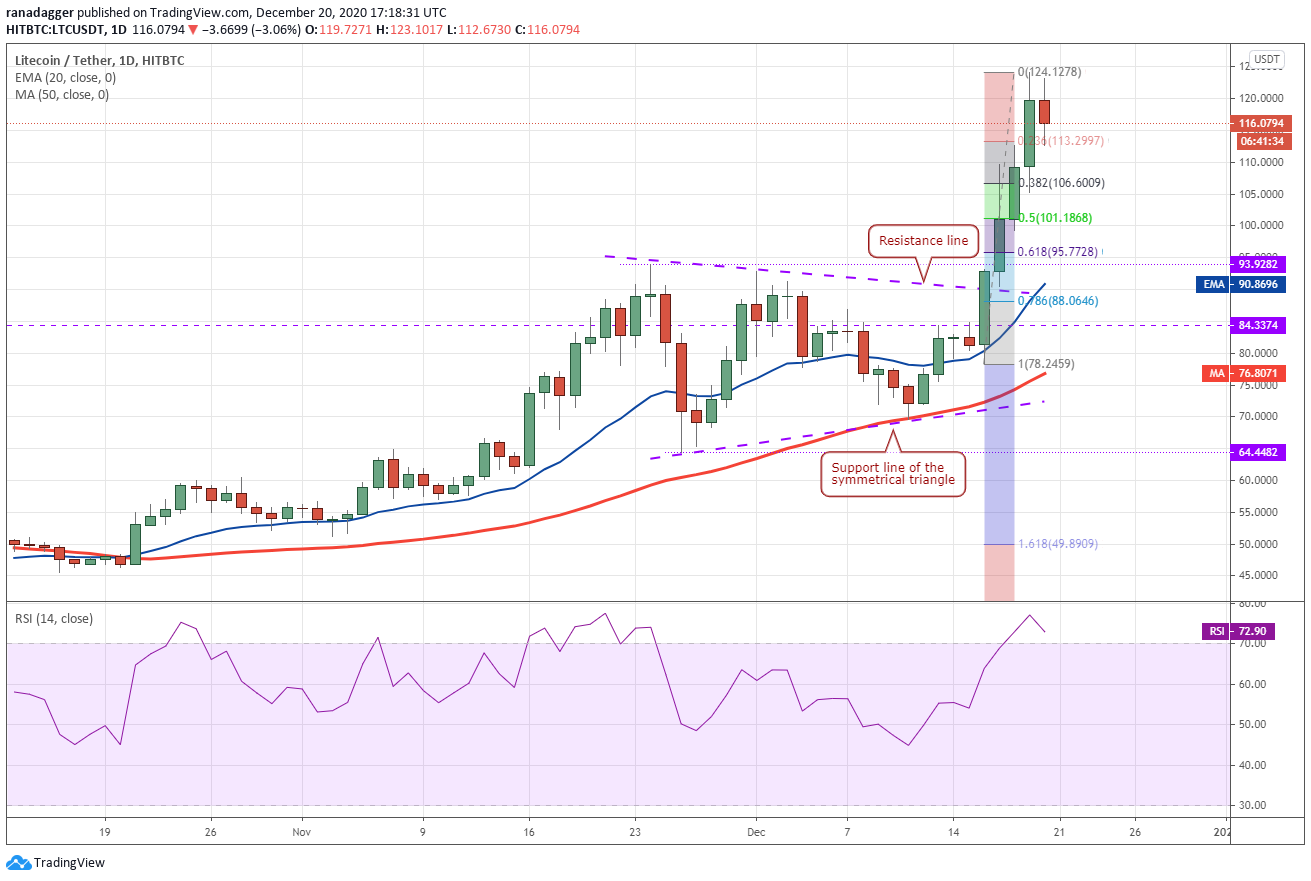
However, the momentum is strongly in favor of the bulls. If the price does not dip below the 50% Fibonacci retracement at $101.868, it will suggest that the bulls are not booking profits in a hurry.
A shallow pullback will increase the possibility of a rally above $124.1278. If that happens, the LTC/USD pair could rally to $140.
Contrary to this assumption, if the price dips below $101.868, the pair could correct to the 20-day EMA ($90). A deeper correction will suggest that the momentum has weakened and that may result in a range-bound action for a few days.
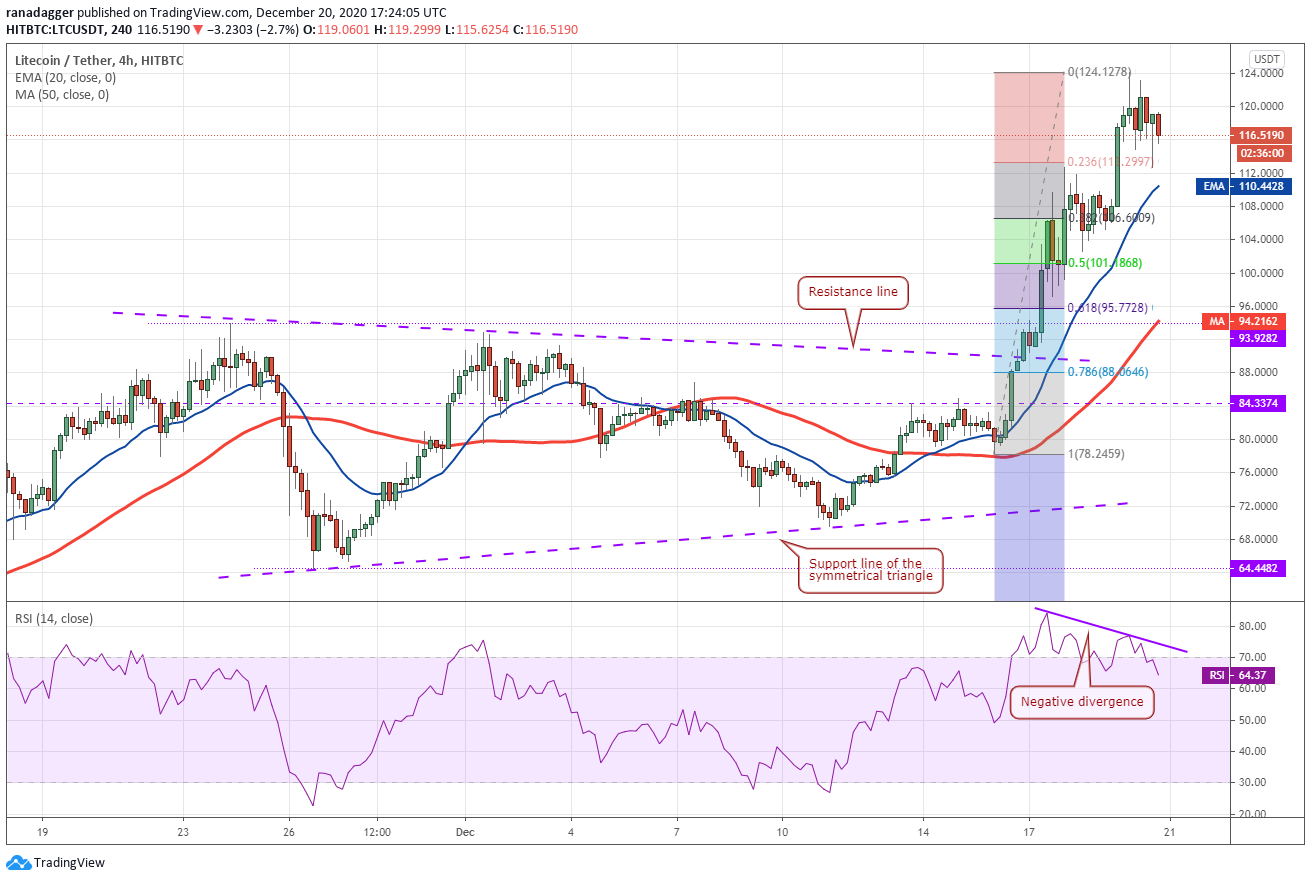
The pair is currently witnessing a correction on the 4-hour chart that may reach the 20-EMA. A strong rebound off this support will suggest that the sentiment is positive and the bulls are buying on dips. If the bulls push the price above $124.1278, the uptrend could resume.
The RSI is showing signs of a negative divergence. If the price dips and sustains below the 20-EMA, it will suggest that the momentum has weakened and a deeper correction may be on the cards.
ADA/USD
Cardano (ADA) has been trading inside a $0.13 to $0.175 range for the past few days. The altcoin turned down from the overhead resistance on Dec. 17 but the bulls have not given up much ground. This shows that traders are in no hurry to book profits.
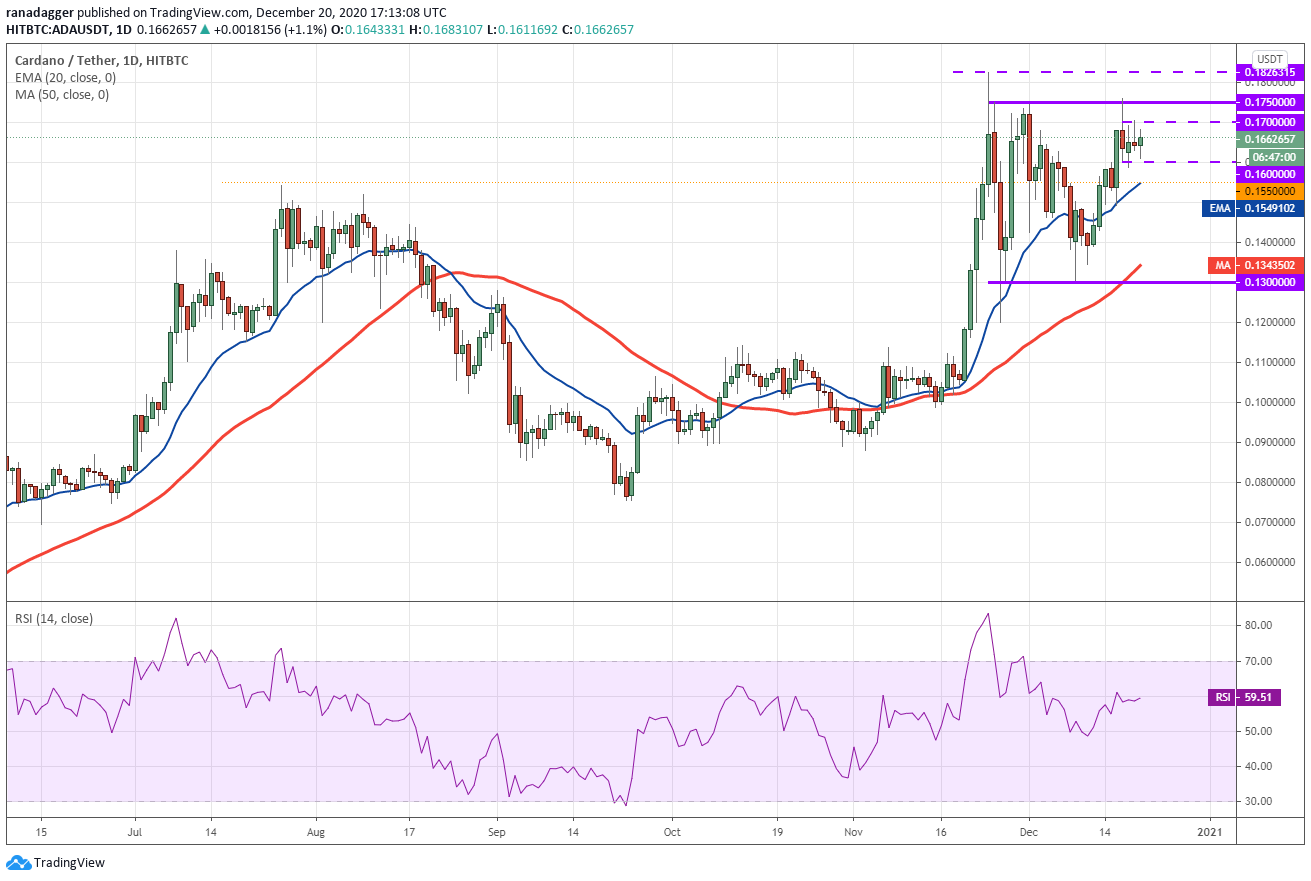
The rising moving averages and the RSI in the positive territory suggest that bulls have the upper hand, If the buyers can propel the price above the $0.175 to $0.1826315 overhead resistance zone, the ADA/USD pair could rally to $0.22 and then to $0.235.
If the price turns down from the current levels but rebounds off the 20-day EMA ($0.154), the bulls will attempt to resume the uptrend.
On the contrary, if the bears sink the price below the 20-day EMA, the pair could drop to $0.13 and extend the stay inside the range.
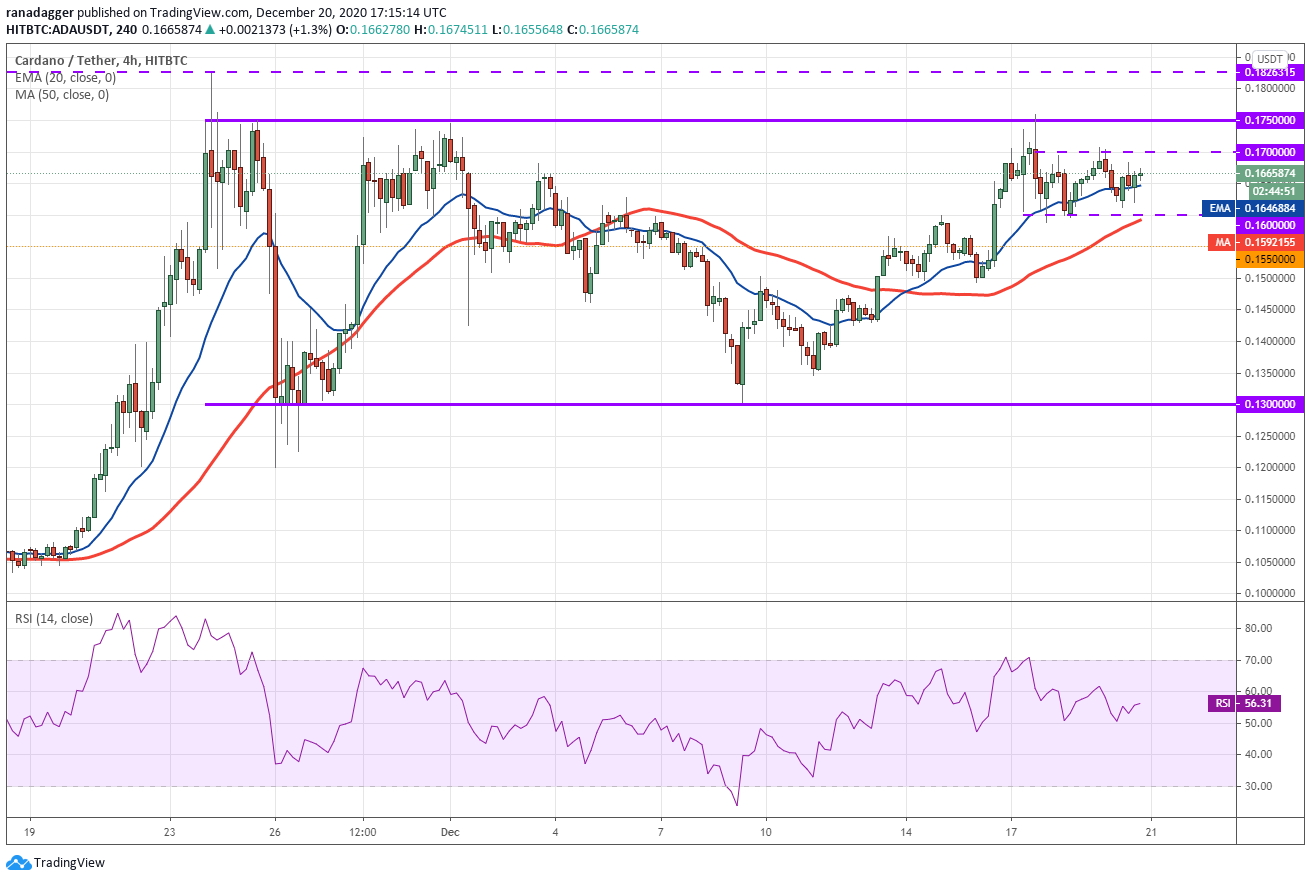
The 4-hour chart shows that the price is currently consolidating in a tight range of $0.16 to $0.17. The flattening 20-EMA and the RSI just above the midpoint suggest a balance between supply and demand.
If the bears sink the price below the 50-SMA, the pair could drop to $0.150 and such a move will increase the possibility of the continuation of the range-bound action.
On the other hand, if the pair rises above $0.17, the bulls will try to push the price above the $0.175 to $0.1826315 resistance zone. If they succeed, the uptrend could resume.
BNB/USD
Binance Coin (BNB) had been stuck in a $25.6652 to $32 range for the past few weeks. The bulls pushed the price above the overhead resistance on Dec. 19 and have followed that with another up-move today.
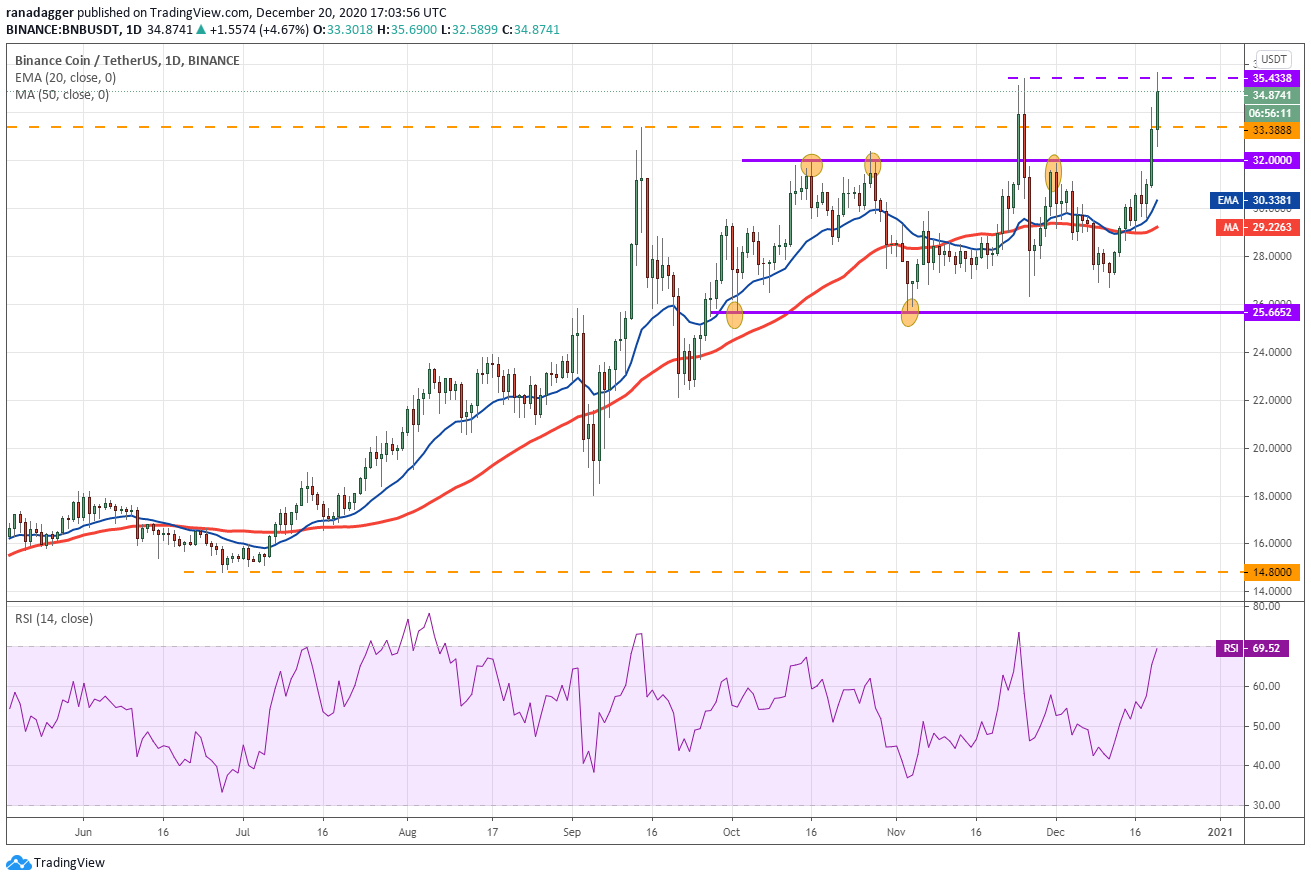
The BNB/USD pair has currently reached the $35.4328 overhead resistance from where the price had reversed direction on Nov. 25. If the bulls can push and sustain the price above this resistance, a retest of the all-time high at $39.5941 is possible.
The 20-day EMA ($30) has started to turn up and the RSI is close to the overbought zone, which suggests that bulls have the upper hand. If the bulls can push the price above $39.5941, the uptrend could continue, with the next target at $50.
This bullish view will be invalidated if the price turns down from the current levels and dips back below $32. Such a move will suggest a few more days of consolidation.
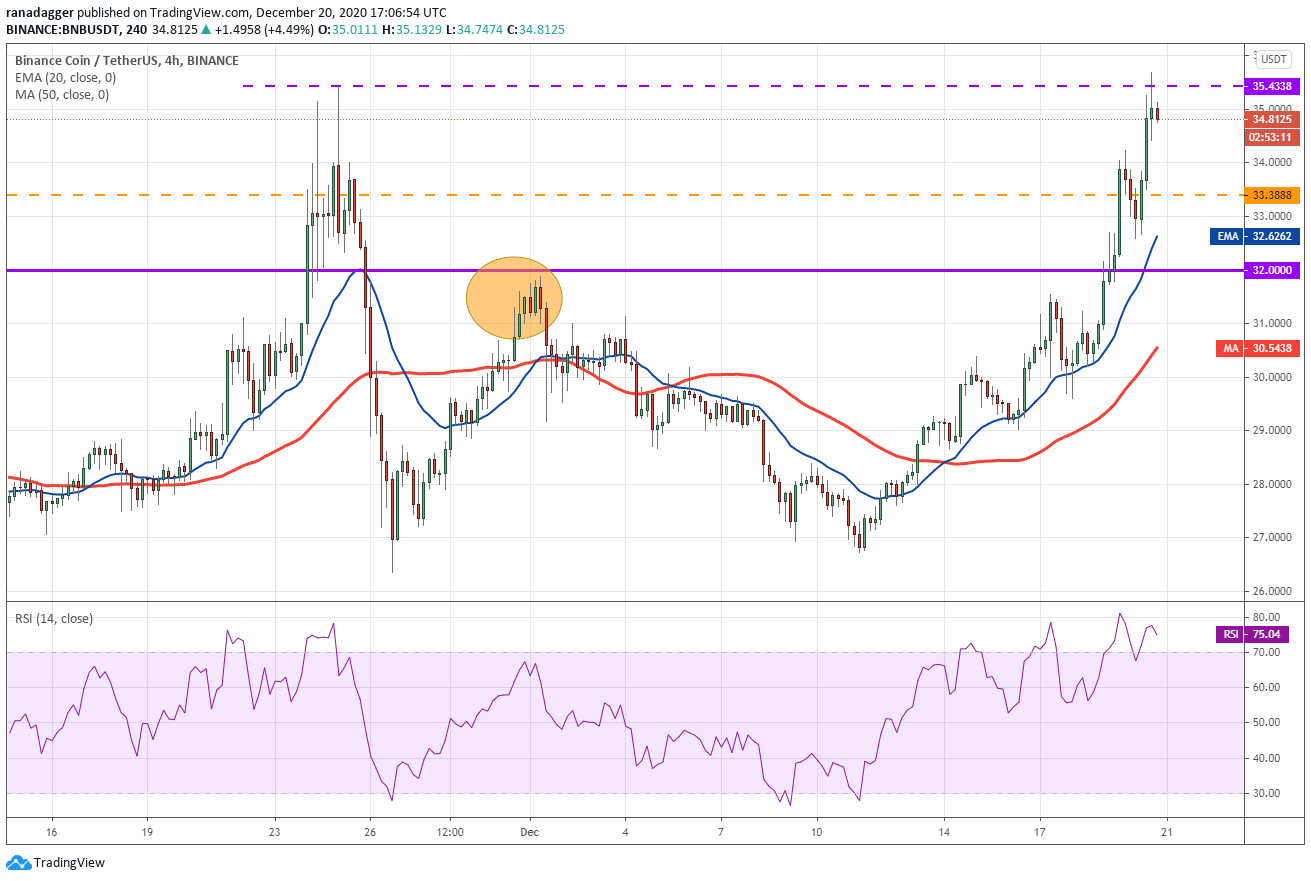
The 4-hour chart shows that the bulls had pushed the price above the overhead resistance but could not sustain the higher levels. This suggests that the bears are aggressively defending the $35.4338 level.
However, the upsloping moving averages and the RSI in the overbought zone suggest advantage to the bulls. If the bulls do not allow the price to slide below $33.3888, it will increase the possibility of a break above $35.4338.
Conversely, if the bears sink the price below $33.3888, a drop to the 20-EMA and then to $32 is possible.
The views and opinions expressed here are solely those of the author and do not necessarily reflect the views of Cointelegraph. Every investment and trading move involves risk, you should conduct your own research when making a decision.


