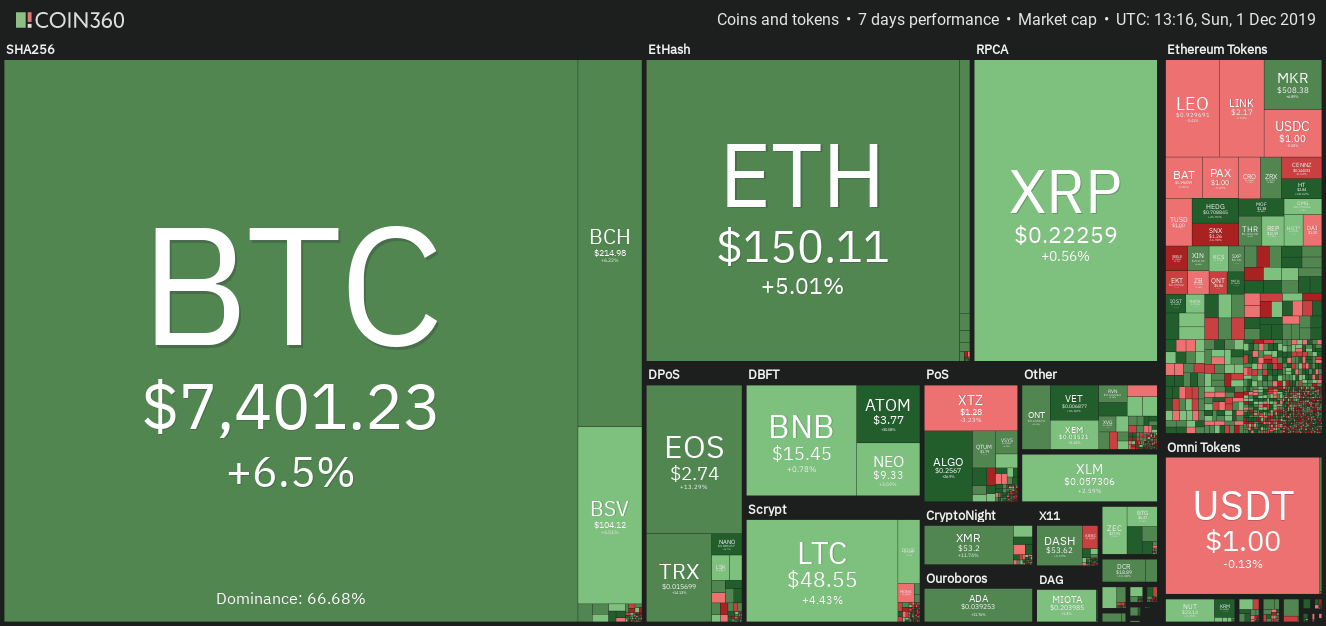
A few of the top performers of the past seven days are showing strength. This suggests that select cryptocurrencies can offer buying opportunities.
This is the second year in a row that November has turned out to be the worst month for Bitcoin (BTC) of the year.
In 2018, Bitcoin’s price had plunged 36.18%. While this year, the decline has been 17.51%. However, December is an important month to watch out for. Since 2015, Bitcoin has moved more than 30% in December. If history were to repeat itself, traders should buckle up for some violent moves in this month.
At least five Chinese cryptocurrency exchanges have halted or terminated operations in November. This is the latest crackdown on crypto trading in China since it banned users from buying cryptocurrencies with fiat money back in September 2017.
According to data from Chainalysis, the Asia-Pacific region, dominated by China, still has about 20 of the 50 top global crypto exchanges. These exchanges accounted for about 40% of Bitcoin transactions in the first half of the year. Hence, the crypto markets react sharply to any major announcement coming out of China.
Crypto market data weekly view. Source: Coin360
While the rise and fall of cryptocurrencies will continue to hog the limelight, we should also keep an eye on the benefits of blockchain technology for society.
A study by Juniper Research shows that the food industry will benefit immensely by using blockchain in conjunction with Internet of Things (IoT) sensors and trackers. This move can result in food fraud savings of up to $31 billion within the next five years.
Can the crypto markets stage a recovery in the final month of the year? What do the charts of the top performers of the past seven days project? Let’s find out.
ATOM/USD
Cosmos (ATOM) has seen huge gains in the past seven days with a 19% rally. During the week, the community approved the Cosmos hub 3 upgrade, which is likely to take place on Dec. 11. Can the altcoin continue its rally in the next few days or will it face profit booking? Let’s analyze its chart.
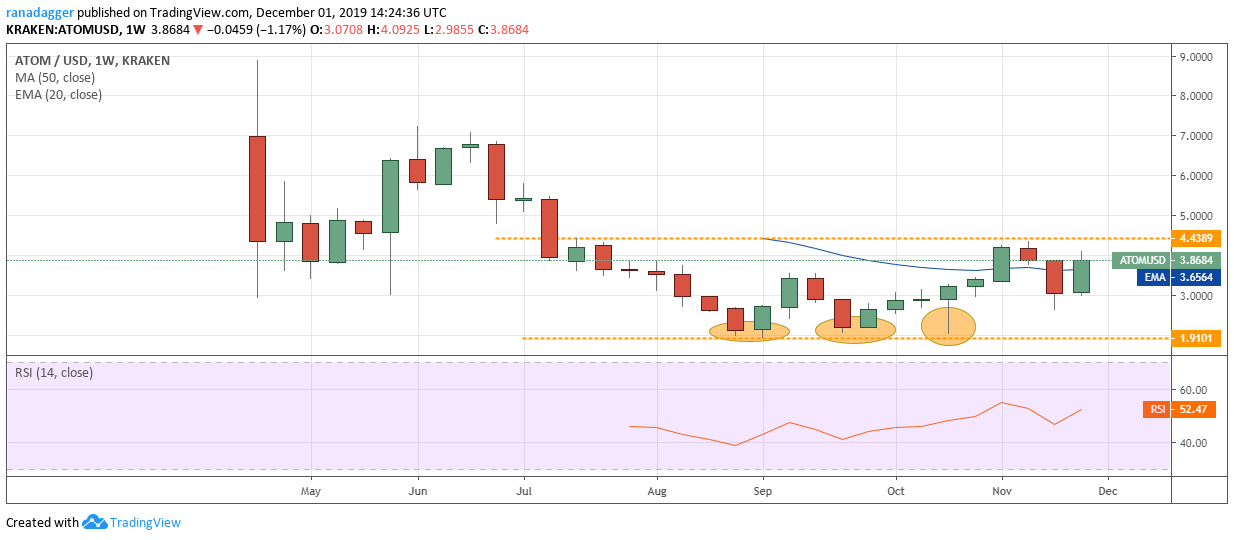
ATOM/USD weekly chart. Source: Tradingview
The ATOM/USD pair is stuck in a $4.4389 to $1.9101 range. The bulls failed to propel the price above the range a couple of weeks back. However, the subsequent dip below $3 was purchased aggressively that has propelled the price back towards the resistance. This is a positive sign as it shows strong demand at lower levels.
We anticipate the buyers to make one more attempt to push the price above the overhead resistance. If successful, the pair might pick up momentum and rally to $7, which is likely to act as a stiff resistance. Therefore, traders can buy on a close (UTC time) above $4.4389 with a stop loss of $2.60.
However, if the bulls fail to push the price above $4.4389, the price might extend its stay inside the range for a few more weeks. The first support on the downside is $2.6218 and below it $1.9101.
TRX/USD
Cryptocurrency exchange Poloniex acquired TRX Market, the largest non-custodial exchange on the Tron (TRX) network, for an undisclosed amount. Following the buyout, Poloniex has renamed TRX Market as “Poloni DEX” and has changed the website to poloniex.org.
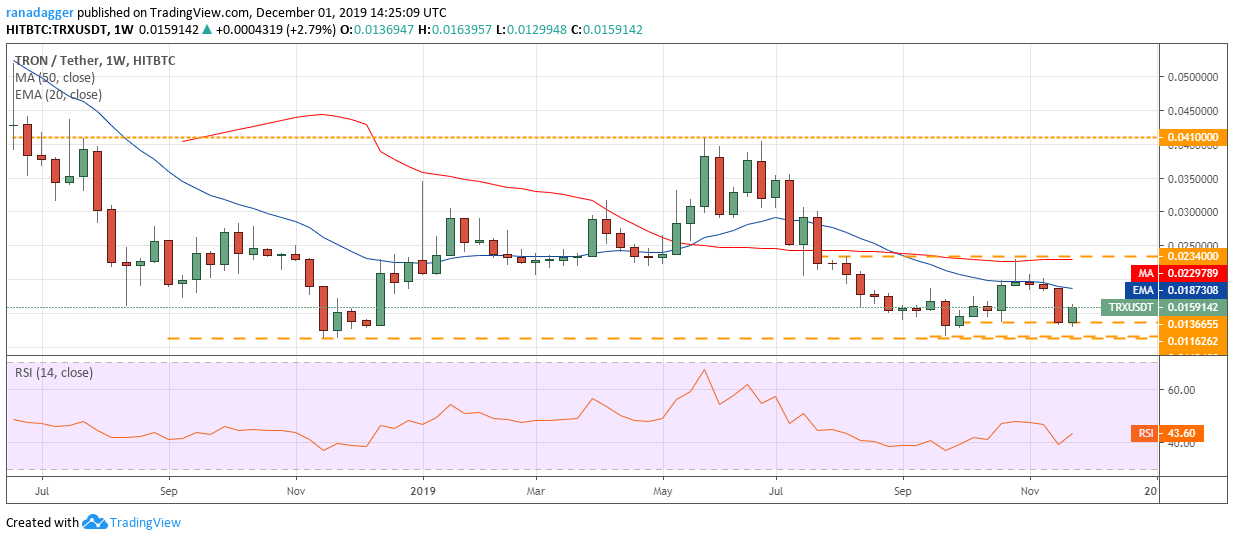
TRX/USDT weekly chart. Source: Tradingview
The TRX/USD pair is stuck in a large range between $0.041 on the upside and $0.011240 on the downside. Currently, the price is attempting to bounce off the minor support close to $0.013 levels.
A strong rebound can carry the price to $0.02340, which is likely to attract sellers. If the price turns down from the overhead resistance, the pair will consolidate between $0.013 and $0.02340, whereas, a breakout of $0.02340 can propel the price to $0.0410
Conversely, if the price turns down from the current levels and plummets below $0.013, a retest of $0.011240 will be on the cards. The 20-week EMA is sloping down gradually and the RSI is still in the negative territory, which suggests that bears are in command. We do not find any reliable buy setups, hence, we remain neutral on the pair.
ADA/USD
The Cardano (ADA) Foundation and fintech platform Coti, have developed AdaPay, an ADA payment gateway for merchants, which offers “near-instant” settlement in 35 fiat currencies directly in their bank accounts. Will this move boost prices in the coming weeks? Let’s study its chart.
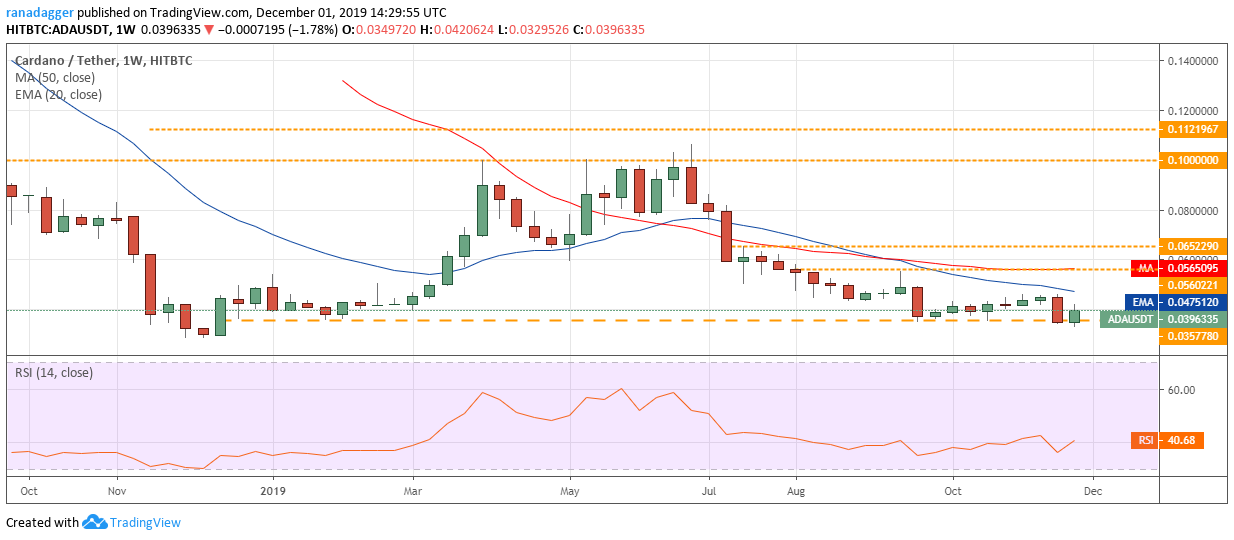
ADA/USDT weekly chart. Source: Tradingview
The bulls have been attempting to defend the support at $0.035778 for the past two weeks. However, with the 20-week EMA sloping down and the RSI in the negative territory, the advantage is with the bears.
If the rebound fails to scale above the 20-week EMA, the bears will attempt to sink the price below $0.035778. If successful, a retest of $0.028271 will be on the cards. Below this level, the downtrend will resume.
The first sign of strength will be a move above the 20-week EMA. Such a move will indicate accumulation by the bulls at lower levels. The ADA/USD pair will pick up momentum on a break above the $0.0560221 to $0.065229 resistance zone.
EOS/USD
Six of EOS’s total pool of Block Producers are being managed by a single entity, according to EOS Block Producer EOS New York.
This again raked up the issue of centralization in the EOS community. However, the altcoin shrugged aside the news and managed to rally about 8% in the past seven days. Can it extend its rally?
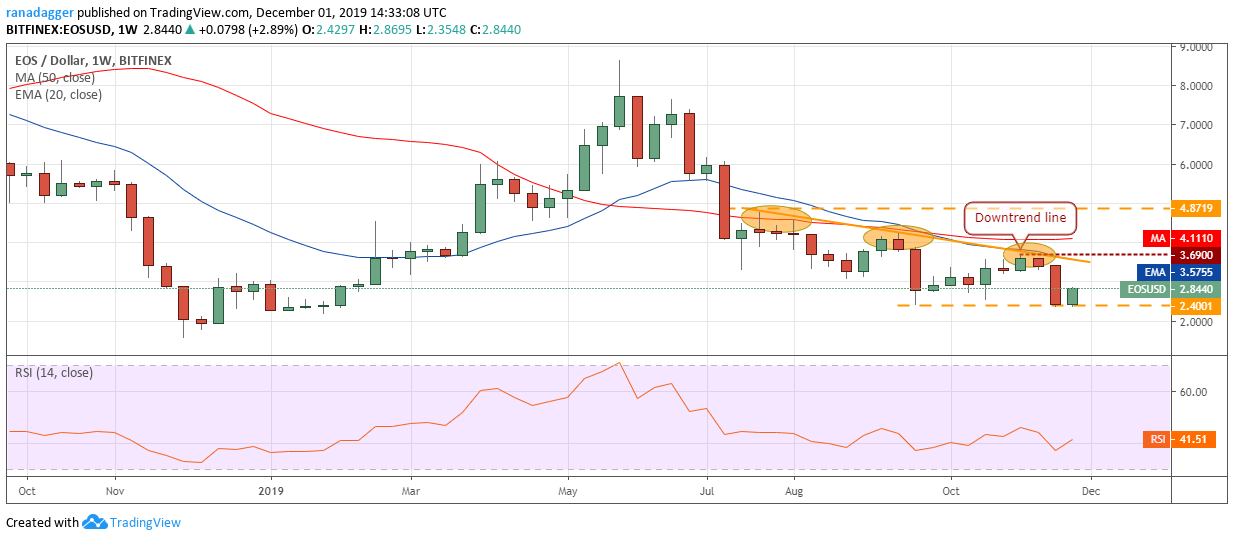
EOS/USD weekly chart. Source: Tradingview
The EOS/USD pair is bouncing off the critical support at $2.4001. This is a positive sign as it shows that buyers are keen to accumulate at lower levels. The price can now move up to the downtrend line.
We anticipate stiff resistance at the downtrend line because three previous relief rallies had been rejected there. If the price again reverses direction from the downtrend line, the bears will attempt to sink it below $2.4001. If successful, a retest of $1.55 is likely.
Alternatively, if the bulls can propel the price above the downtrend line, a move to $4.8719 is can occur. The pair will pick up momentum on a break above this level.
XMR/USD
A few crypto exchanges are delisting privacy-centric coins to appease regulators. Cryptocurrency exchange BitBay, for example, will delist Monero (XMR) on Feb. 19 next year.
Security firm Eset has reported that cybercriminals have been using YouTube channels to distribute a Monero cryptocurrency mining module. However, after Eset informed YouTube, the channels were removed. Business technology publication ZDNet has reported that hackers have launched a new cryptojacking campaign to target vulnerable Docker instances to deploy crypto-malware to mine Monero.
Even though the news flow has not been supportive, the altcoin has turned out to be the fifth-best performer of the past seven days. Do the technicals project a further rally? Let’s find out.
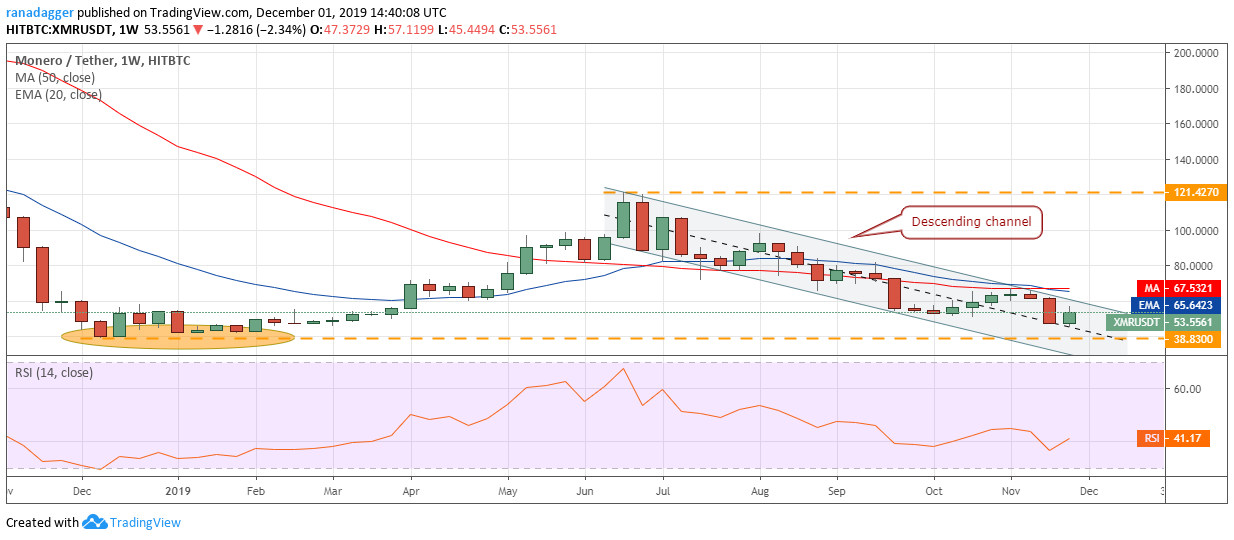
XMR/USDT weekly chart. Source: Tradingview
The XMR/USD pair has been trading inside a descending channel for the past few months. A breakout of the channel and the moving averages will be the first sign that the downtrend might be over.
If the price closes (UTC time) above the moving averages, we anticipate a move to $121.427. Therefore, traders can initiate long positions on a close (UTC time) above the moving averages with a stop below $38.
However, if the price fails to sustain above the channel, the bears will attempt to sink the pair below the critical support at $38.83. This is an important level to watch out for because if it cracks, the downtrend will resume.
The views and opinions expressed here are solely those of the author and do not necessarily reflect the views of Cointelegraph. Every investment and trading move involves risk, you should conduct your own research when making a decision.
The market data is provided by the HitBTC exchange.


