The up move in the top crypto performers of the past seven days shows that bulls are back in the game.
The CME Group will launch its Bitcoin options contract on Jan. 13. The analysts at JPMorgan Chase & Co. have spotted a 69% increase in open interest from year-end in CME’s existing Bitcoin futures contracts.
They also noted that the number of large open-interest holders has picked up. This shows an increase in institutional interest before the launch of options trading. Nevertheless, as Bitcoin price action has been mixed during previous launches of such services, it is difficult to predict the move based on this event alone.
Halving, however, is an important event and analysts at market research firm Fundstrat Global Advisors believe that it has not yet been “priced into” Bitcoin’s price. Hence, they anticipate Bitcoin to rally more than 100% this year. Increasing geopolitical tensions and the United States Presidential elections later in the year could also act as a catalyst for the up move.
Crypto market data weekly view. Source: Coin360
The U.S., which had been the leader in overall Bitcoin transaction volume since 2013 has been pushed to the third spot in 2019. The top two positions have been taken by Singapore and Seychelles.
After a long time, most major cryptocurrencies are likely to be in the positive on a weekly basis. This shows that the buying has been broad-based, which is a positive sign. With the sentiment gradually turning around, can the top performers of the past seven days build upon their gains? Let’s study the charts.
BSV/USD
Bitcoin SV (BSV) surged about 43% in the past seven days to claim the top spot. The altcoin has been the best performer among major cryptocurrencies for the second consecutive week.
It is speculated that Craig Wright, who claims to be Satoshi Nakamoto, submitted more documents to the court in an ongoing legal battle with the estate of former business partner Dave Kleiman, which might have details of a trust that holds his Bitcoins. Some analysts believe that this news was one of the reasons for the sharp rally in Bitcoin SV. Can the altcoin rally further or is it time to book profits? Let’s analyze the charts.
BSV USD weekly chart. Source: Tradingview
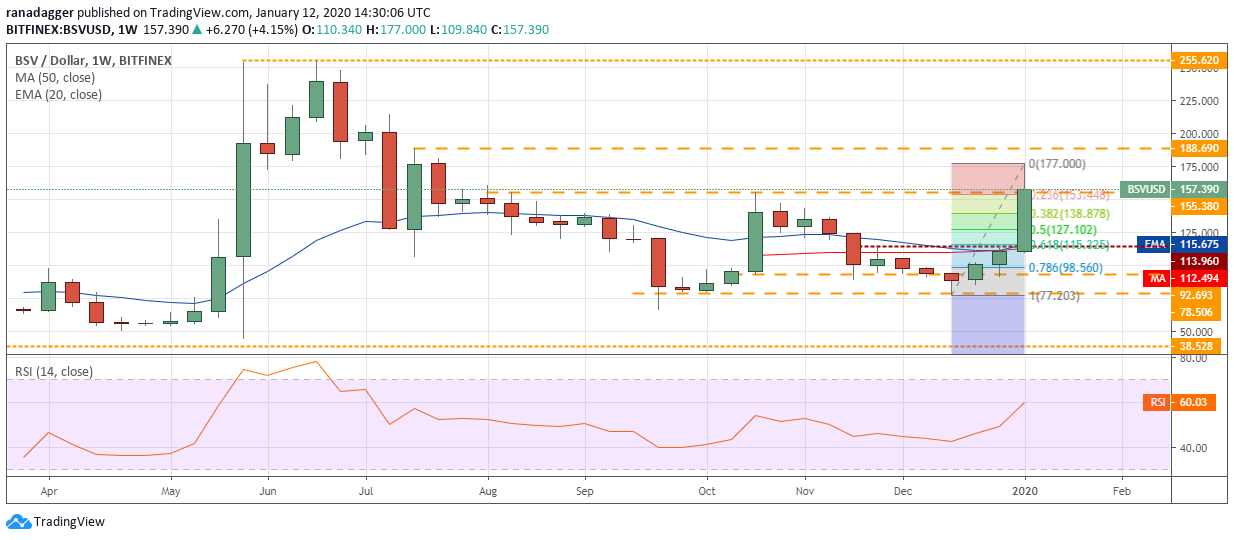
The bulls easily scaled the overhead resistance levels at $113.96 and $155.38. This shows that the BSV/USD pair is backed by momentum. After the sharp rally, the bulls might face stiff resistance at $188.69.
Though it is too early to call a short-term top, the pair might enter a minor correction or consolidation for the next few weeks. If the bulls can hold the price above $155.38, it will signal strength and increase the likelihood of a breakout above $188.69.
If the bulls scale above $188.69, a retest of the lifetime highs at $255.62 is possible. Our bullish view will be invalidated if the correction drags the price below $127.102, which is 50% Fibonacci retracement level of this leg of the up move.
DASH/USD
Dash (DASH) has found a place among the top crypto performers after a long gap. The altcoin surged about 29% in the past seven days. The recovery in price started on the news that Burger King Venezuela would start accepting cryptocurrency payments.
Initially, only one store will accept cryptocurrencies but later, 40 other locations would join by the end of this year. Does the cryptocurrency show signs of having bottomed out? Let’s study the chart.
DASH USD weekly chart. Source: Tradingview
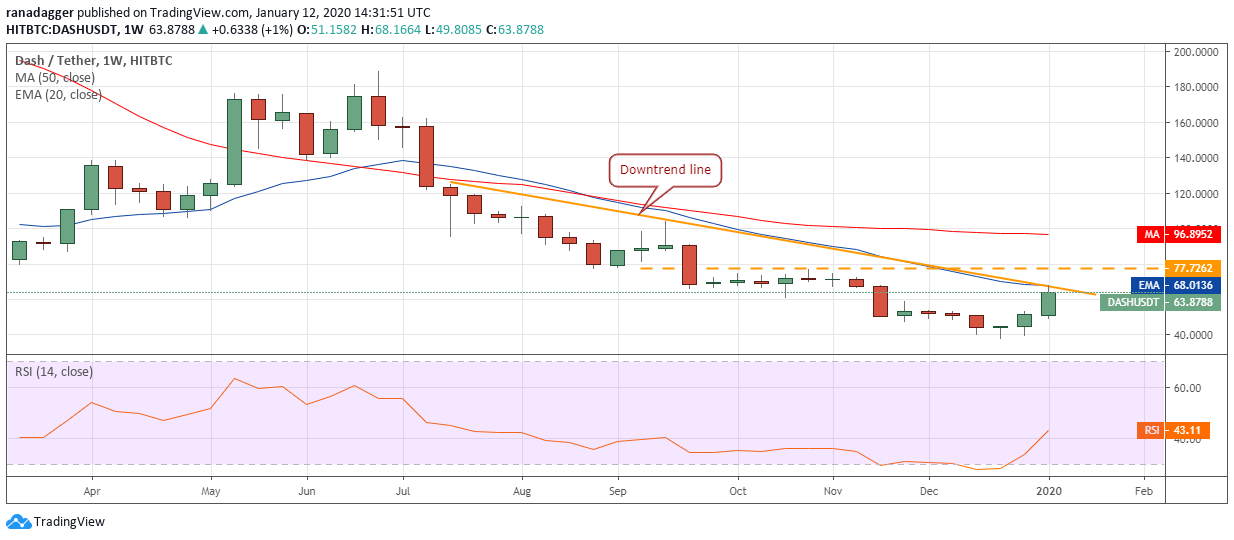
The DASH/USD pair has been a huge underperformer in the past few months. It slipped from a high of $188.5598 in June to a low of $38.2558 in late Dec. After the sharp down move, the bulls stepped in closer to $40.
The relief rally has carried the price to the downtrend line. The 20-week EMA is also placed close to the downtrend line. Hence, we anticipate the bears to defend this level aggressively. A breakout of the 20-week EMA will indicate a possible change in trend.
Above the downtrend line, the next level to watch out for will be $77.7262, which might again act as a stiff resistance. If the price turns down from the current levels or from $77.7262, the pair might remain range-bound for a few weeks. The pair will pick up momentum on a break above $77.7262.
LINK/USD
Chainlink (LINK) was the third-best performer of the past seven days with a rally of over 24%. Does the current rise indicate a change in trend? Can LINK build on its strength over the next few weeks? Let’s study its chart.
LINK USD weekly chart. Source: Tradingview
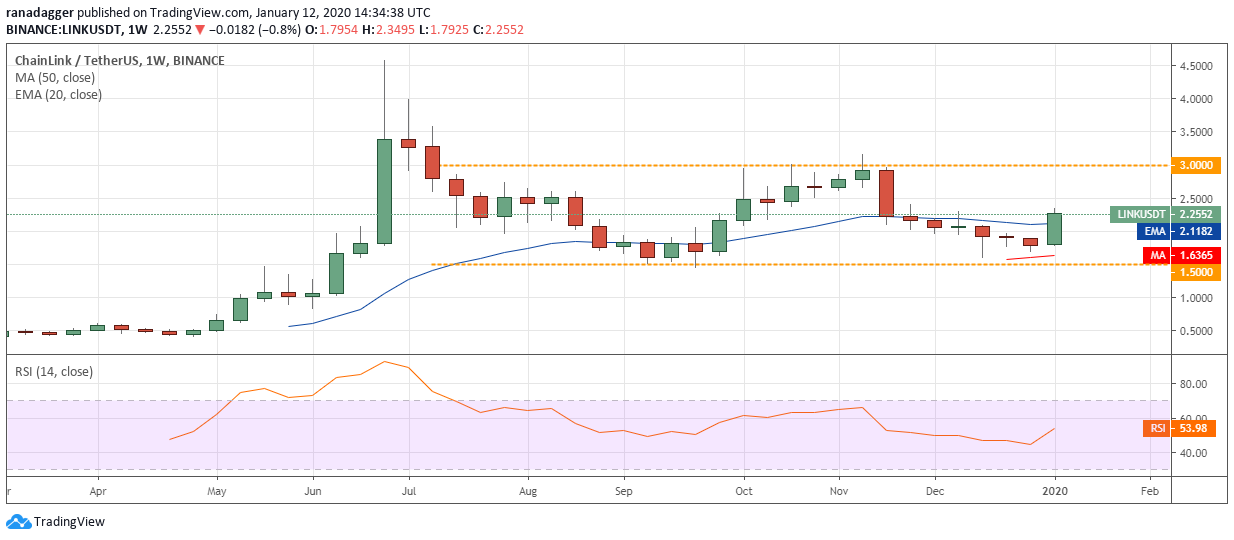
The LINK/USD pair has largely been range-bound between $1.50 and $3 for the past few months. This shows that bulls purchase close to support of the range and book profits near resistance. The current up move can reach $3 in the next few weeks.
If the bulls succeed in pushing the price above $3, a rally to the lifetime high is likely. Conversely, if the price turns down from $3, a few more weeks of range-bound action is possible. The pair will turn negative on a break below the strong support at $1.50.
BCH/USD
Bitcoin Cash (BCH) also benefited from the news surrounding Craig Wright. The altcoin rallied about 18% in the past seven days. This is the third consecutive week that Bitcoin Cash has been among the top performers. After the recent rally, is it time for a reversal or can the up move extend further?
BCH USD weekly chart. Source: Tradingview
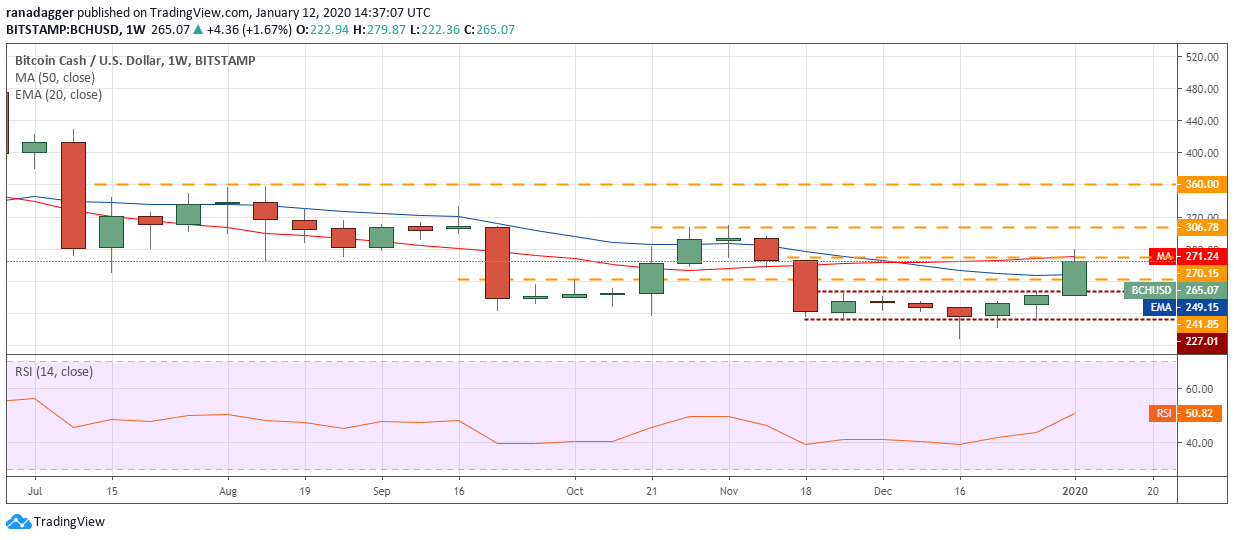
After six weeks of range-bound trading between $227.01 to $192.52, the BCH/USD pair broke out and rallied above the overhead resistance at $241.85 and $270.15. This shows a pick up in momentum.
However, the bulls are struggling to sustain the price above $270.15, which suggests a few weeks of consolidation or minor correction.
We anticipate the bulls to provide support at $241.85. If this support breaks, it will weaken the momentum. On the other hand, if the price consolidates for a few weeks close to the current levels, it will indicate strength and will increase the possibility of a move to $306.78.
LTC/USD
Litecoin (LTC) rounded up the list of the top five performers of the past seven days with a rally of about 18%. Litecoin’s mining difficulty, which had dropped sharply in the second half of 2019, has begun rising again. This could spark a bull run in the altcoin, according to a few analysts.
In other news, cryptocurrency lending company BlockFi has added support for Litecoin, which is positive. While the fundamentals point to an up move, do the technicals also support a rally? Let’s find out.
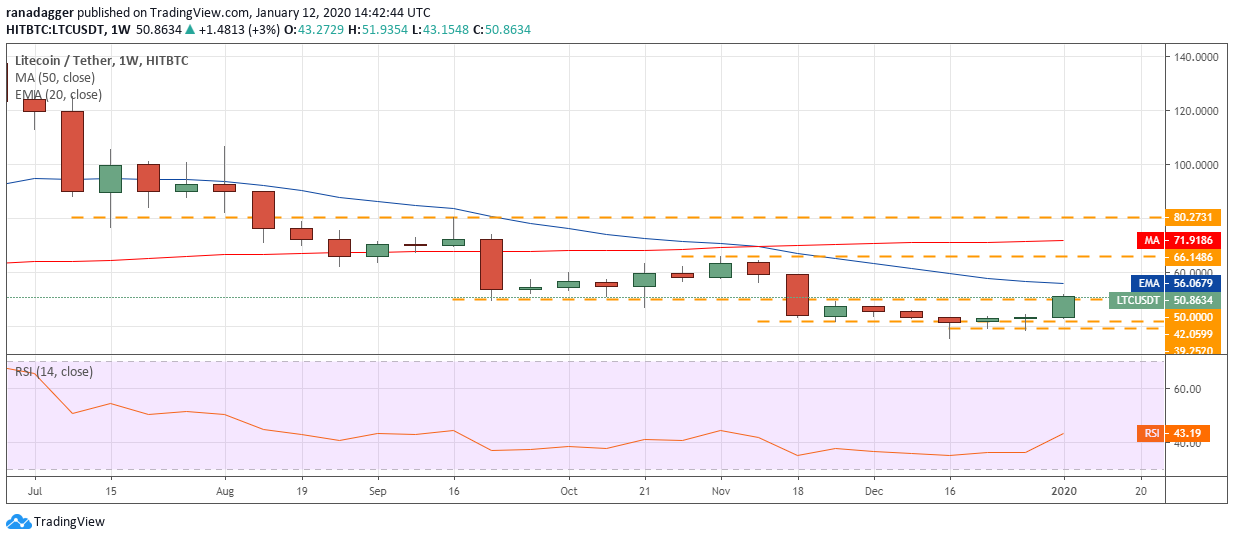
LTC USD weekly chart. Source: Tradingview
The breakdown from the $50 to $42.0599 range did not find sellers at lower levels. This shows that aggressive bulls used the fall to accumulate. The buyers are currently attempting to propel the price above the range.
If successful, the LTC/USD pair can move up to $66.1486. Though the 20-week EMA might act as a resistance, we expect it to be crossed. Both moving averages have flattened out and the RSI is gradually moving towards the center, which shows that the bears are losing their grip.
Our bullish view will be invalidated if the bulls fail to sustain the price above $50. In such a case, the pair might remain range-bound between $50 and $39.252 for a few more weeks. A break below this range will resume the downtrend.
The views and opinions expressed here are solely those of the author and do not necessarily reflect the views of Cointelegraph. Every investment and trading move involves risk, you should conduct your own research when making a decision.
The market data is provided by the HitBTC exchange.
If You Liked This Article Click To Share


