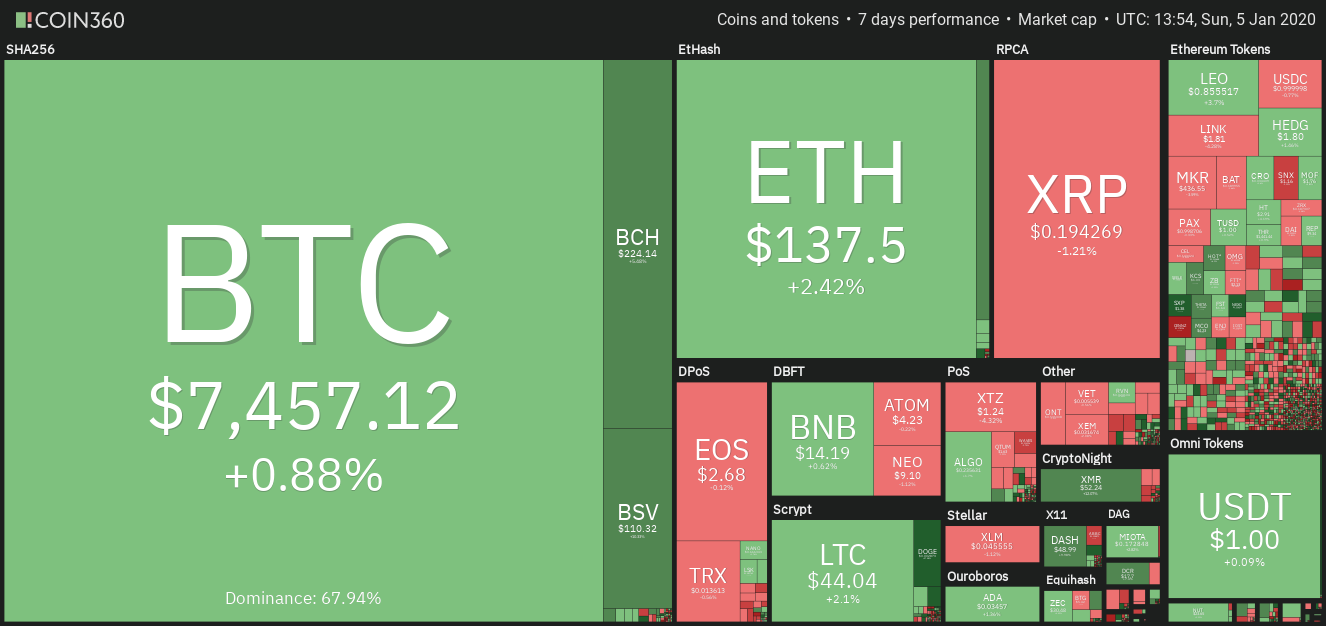
Few of the top five cryptocurrency performers of the past seven days are showing signs of bottoming out. Can they start a new uptrend?
Coinbase CEO Brian Armstrong believes that rising cryptocurrency prices will generate massive wealth for the crypto investors in the 20s. His friends, Olaf Carlson-Wee and Balaji Srinivasan expect Bitcoin’s price to reach $200,000, due to which more than half of the world’s billionaires will be from the crypto space. Armstrong also anticipates that “ a “privacy coin” or blockchain with built-in privacy features” will go mainstream in the 2020s.
A Burger King outlet in Venezuela has started accepting Bitcoin and a few other cryptocurrencies. This is likely to expand to about 40 locations this year. While this is a positive sign, previously, similar initiatives in Russia and Europe have not been able to pick up momentum. This shows that most investors do not want to spend their cryptocurrencies at the current levels as they expect higher prices in the future.
Crypto market data weekly view. Source: Coin360
In 2019, Bitcoin’s price largely remained in a range during the first quarter and made a decisive move in the second quarter. Currently, Bitcoin seems to be following a similar pattern of consolidation as of last year. However, with Bitcoin halving due in May of this year, the price action is likely to pick up momentum soon.
While Bitcoin might take center stage in a few weeks’ time, currently, the altcoin space has been buzzing with activity. A few of the top performers of the past week are showing signs of having bottomed out. Do we find any buying opportunities in them? Let’s analyze their charts.
BSV/USD
Bitcoin SV (BSV), which was the second-best performer of the past week, has continued its momentum and risen about 15% in the past seven days. After the recent run-up, should traders book profits or can the price rally further? Let’s analyze its chart.
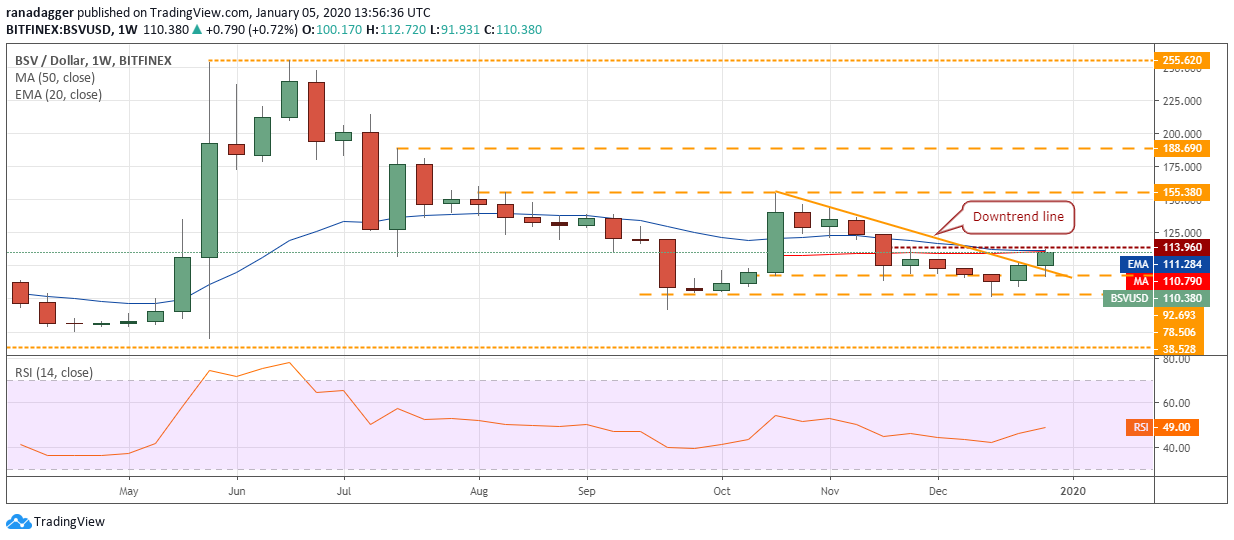
BSV USD weekly chart. Source: Tradingview
The BSV/USD pair has broken out of the downtrend line and has reached the first overhead resistance at $113.96. The moving averages are also located close to this level, hence, we anticipate the bears to mount a strong defense of the resistance.
A breakout of $113.96 can propel the pair to the next target at $155.38. Both moving averages are flat and the RSI has risen close to the center, which indicates that the selling pressure has reduced.
Our bullish view will be invalidated if the price turns down from the current level. In such a case, the pair might remain range-bound for a few more weeks. The downtrend will resume if the bears sink the price below the $78.506 to $66.666 support zone.
XMR/USD
Monero (XMR) was the second-best performer of the past seven days, with a rally of about 13%. The privacy coin received a boost when Europol strategy analyst Jarek Jakubcek said in a webinar that the transactions conducted using the Monero blockchain were not traceable even after extensive research. While this feature might be positive, it will also pose significant hurdles from the regulators in the future. Has the altcoin bottomed out?
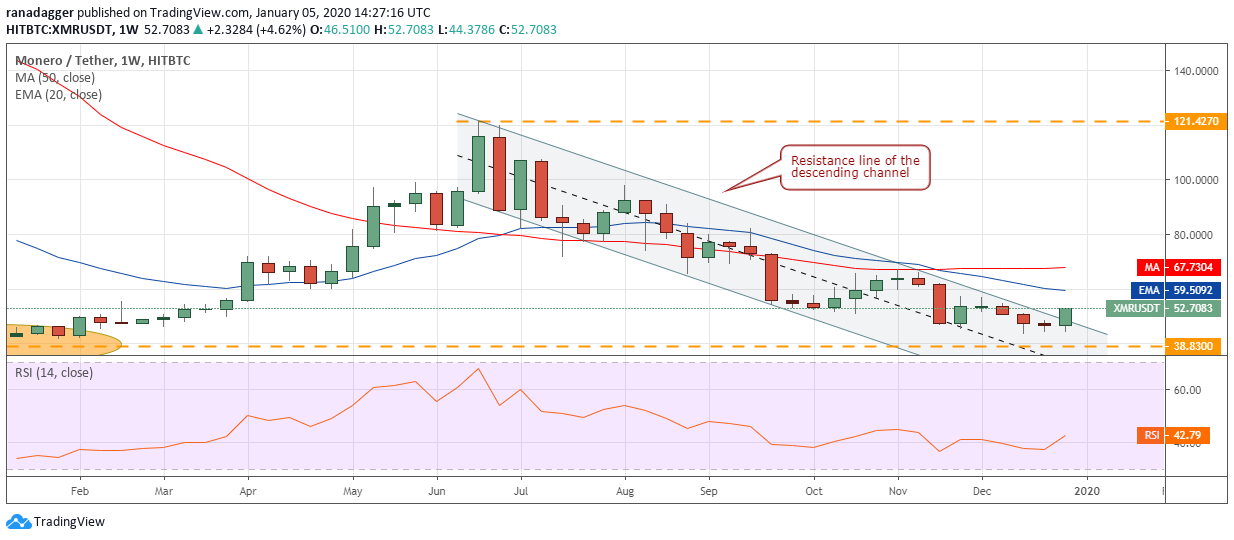
XMR USD weekly chart. Source: Tradingview
The XMR/USD pair has broken out of the downtrend line. This suggests that the downtrend is likely over. The price might climb up to the moving averages, which will act as a resistance. The flattish moving averages point to a likely range-bound action for a few weeks.
A breakout of the moving averages might carry the price to $100 and above it to $121.427. Therefore, traders can buy at the current levels and keep a stop loss of $38. If the price struggles to break out of the moving averages, the stops can be trailed higher.
Our bullish view will be invalidated if the pair turns down from the current levels and slides below the recent lows.
ETC/USD
Ethereum Classic (ETC) was once again the third-best performer of the past seven days, with a rally of about 6%. This shows that the bulls have been buying at lower levels. Does the technical picture point to further gains? Let’s analyze its chart.
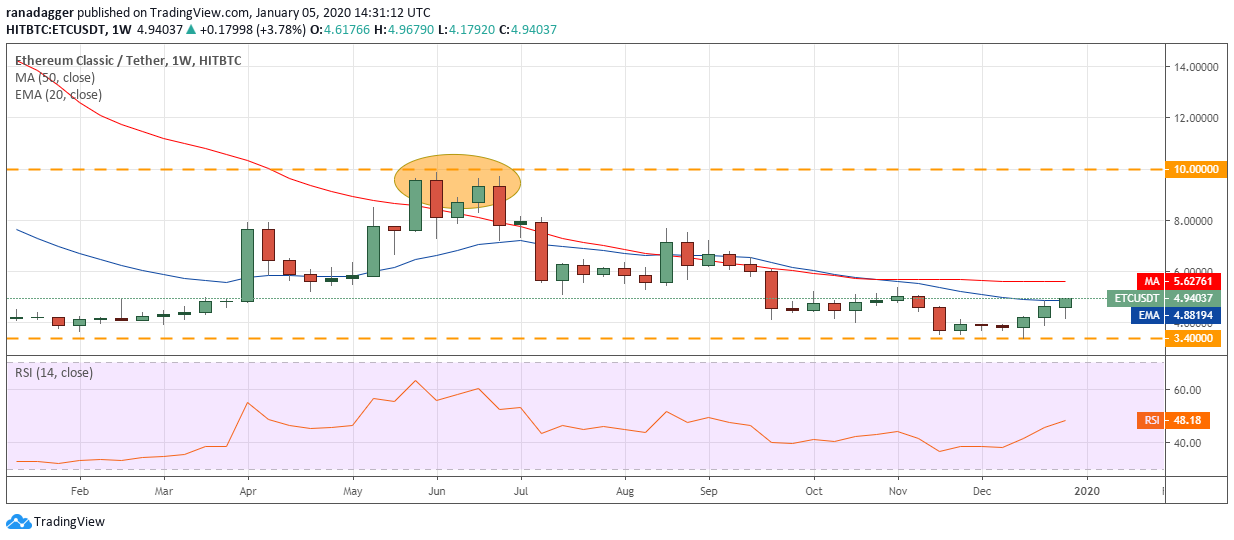
ETC USD weekly chart. Source: Tradingview
The relief rally in ETC/USD pair has reached the 20-week EMA. Above this level, a move to the 50-week SMA is possible. We anticipate the bears to mount a strong defense at the 50-week SMA. If the price turns down from this level, it might remain range-bound for a few more weeks. The flattish moving averages and the RSI close to the center also point to a consolidation.
However, if the bulls can push the price above the 50-week SMA, the traders can buy the remaining position as suggested in our previous analysis. Above the moving averages, a rally to $7.6 and above it to $10 is likely.
Our bullish view will be invalidated if the bears sink the price below $3.40. Therefore, traders can retain the stop loss on the long positions at $3.30.
BCH/USD
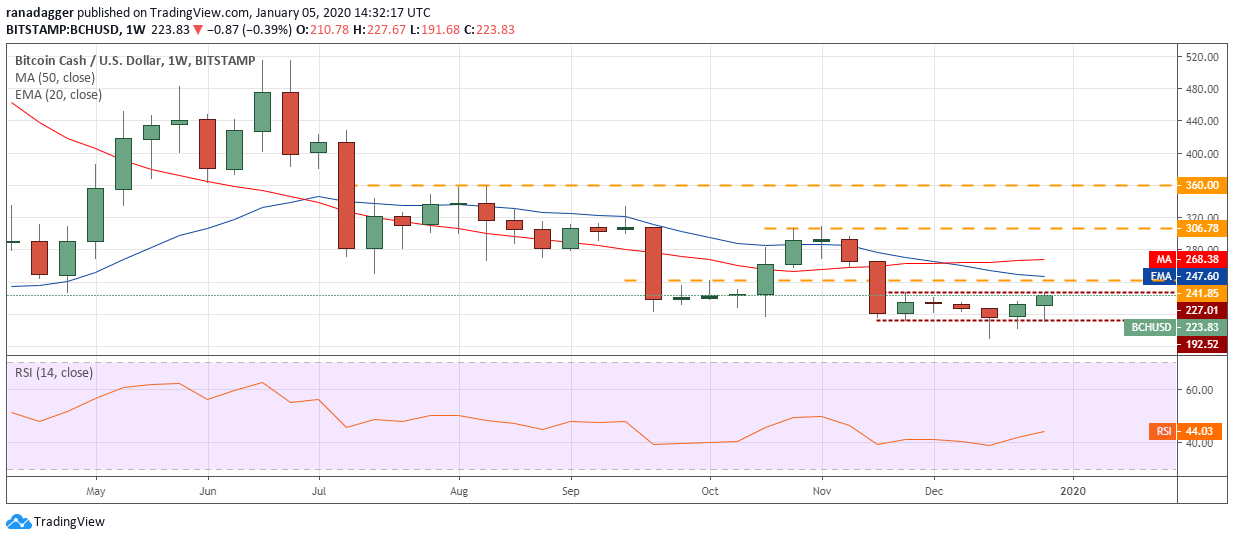
Bitcoin Cash (BCH) has also made it to the top performer list for the second successive week. It rallied close to 5% in the past seven days. Do the technicals point to a further rally or is it time to book profits? Let’s study the chart.
BCH USD weekly chart. Source: Tradingview
The relief rally in the past two weeks has carried the price to the top of the $227.01 to $192.52 range. We anticipate the bears to offer stiff resistance at this level. The flattish moving averages also suggest a range-bound action for a few weeks.
However, if the bulls can push the price above $227.01, the BCH/USD pair might move up to the 50-week SMA and above it to $306. Therefore, traders can initiate long positions as suggested in our previous analysis.
Our bullish view will be invalidated if the pair turns down from the current levels and breaks below $192.52.
LEO/USD
UNUS SED LEO (LEO) with a gain of about 4% rounded up the top five performers of the past seven days. On Dec. 28, Bitfinex tweeted that it had completed the burning of the first 10 million LEO tokens. Let’s analyze its chart to see if we spot any buying opportunities.
LEO USD weekly chart. Source: Tradingview
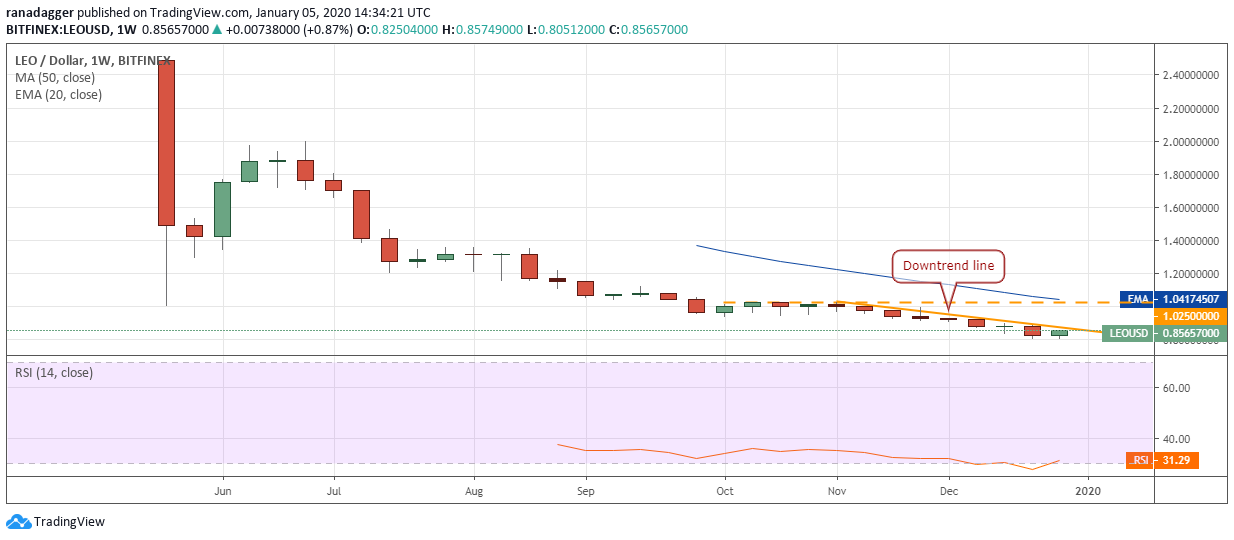
The LEO/USD pair had been consistently making new lows for the past few weeks. This shows that the bulls did not believe that the price had become attractive enough for them to start accumulating.
However, closer to $0.80, we find the first signs of buying. There is a small downtrend line, above which, a move to $1.025 is possible. The 20-week EMA is also placed just above this level, hence, we anticipate the bears to defend $1.025 aggressively.
If the price turns down from $1.025, the bears will attempt to resume the downtrend. A break below $0.80 will signal the resumption of the down move. However, if $0.80 holds, the pair might enter into a period of consolidation. We do not find any buy setups at the current levels, hence, we suggest traders remain on the sidelines. We will wait for the price to rise above $1.025 before turning positive.
The views and opinions expressed here are solely those of the author and do not necessarily reflect the views of Cointelegraph. Every investment and trading move involves risk, you should conduct your own research when making a decision.
The market data is provided by the HitBTC exchange.


