The Bitcoin—altcoin couple is the reason why altcoins resurgence depends on Bitcoin price ticks. At the moment it is a Bitcoin winter and altcoins are struggling. TRX/USD and EOS/USD prices are trending below key support levels despite Ledger Nano S providing support for EOS dApps.
Let’s have a look at these charts:
EOS/USD Price Analysis
Despite the biting market conditions, you can now use your Ledger Nano S to interact with EOS dApps. Nonetheless, some functions as Chintai or removing orders from DEXs aren’t available. Ledger will soon release a firmware to fix this. To explore EOS dApps, all you have to do is update the Ledger Live app and the EOS software before activating “arbitrating data” under settings. Thereafter you can import your Ledger Key into Scatter and you are good to go.
Price wise EOS is perched at fifth but volatility is low shedding 1.2 percent in the last day. Nevertheless, our previous EOS/USD trade plan is valid. As long as EOS is trading below $4, investors can unpack EOS at spot and wait for prices to shrink to $1.5 before searching for buying opportunities on pull backs. Meanwhile traders can short at spot prices with stops at Nov 20 highs at around $4.3 aware that price spikes that hit these stops invalidate this projection.
LTC/USD Price Analysis
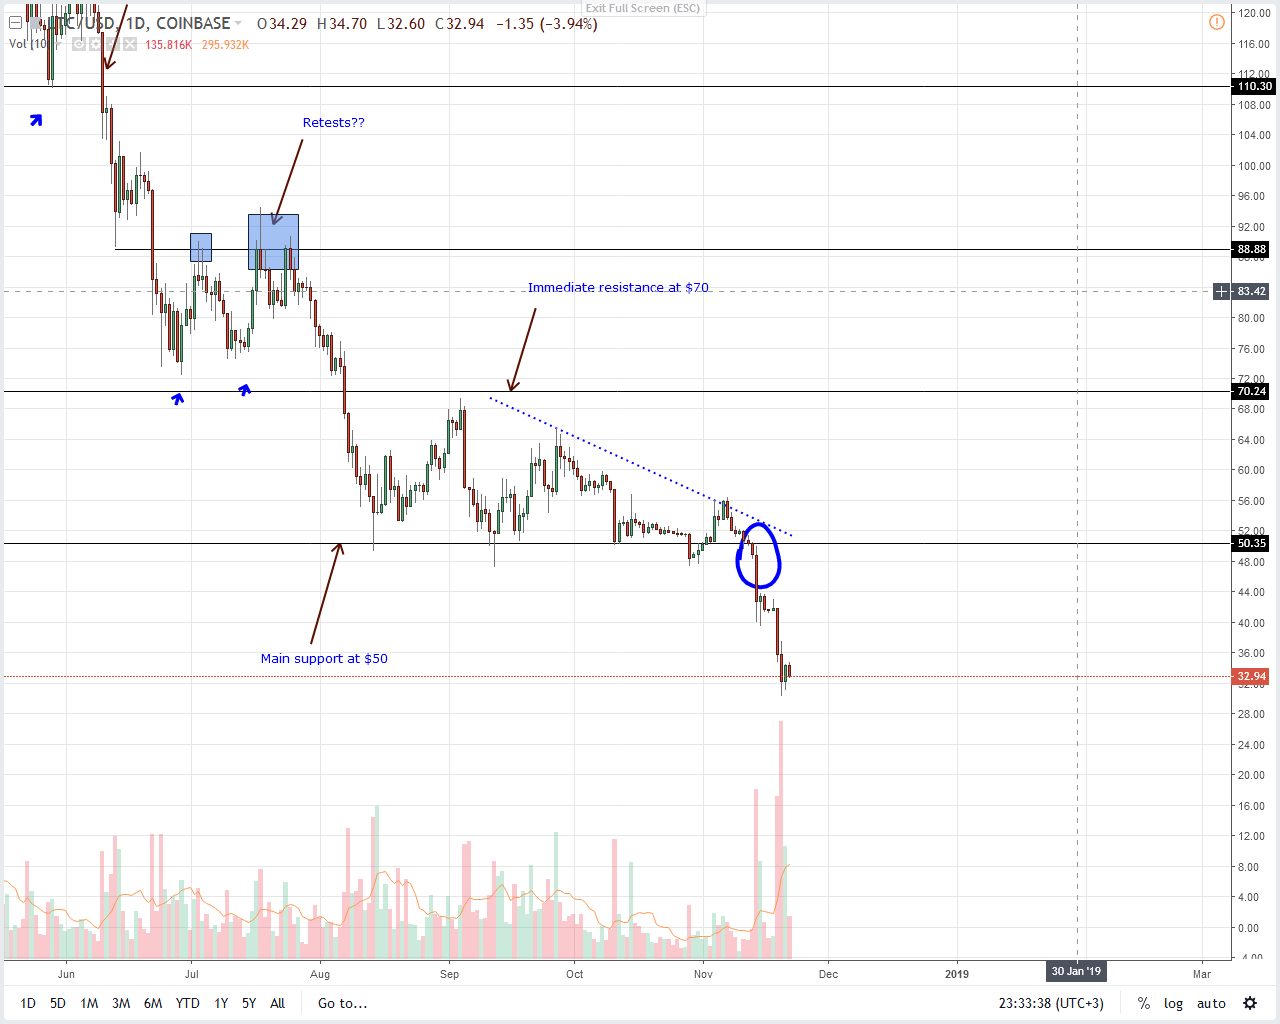
It’s all red for Litecoin and like before, sellers are in charge. However, at spot prices and factoring in volumes and weekly trade ranges, odds are LTC prices would bounce back towards $40 or Nov 20 highs. Because of this we recommend traders to hold off from unloading at spot prices and instead exercise patience.
Read: Top Tech Stocks Lost More Than Entire Crypto Market Since All-Time High
Once there is a recovery and bulls print higher, investors seeking to cut losses can exit while traders can initiate shots with stops at $45-$50 and first targets at $30, $20 or even $15. However strong high volume surges clearing $50 would invalidate this bear projection as it would perhaps trigger the next wave of buy activity thrusting prices towards $55–$60.
XLM/USD Price Analysis
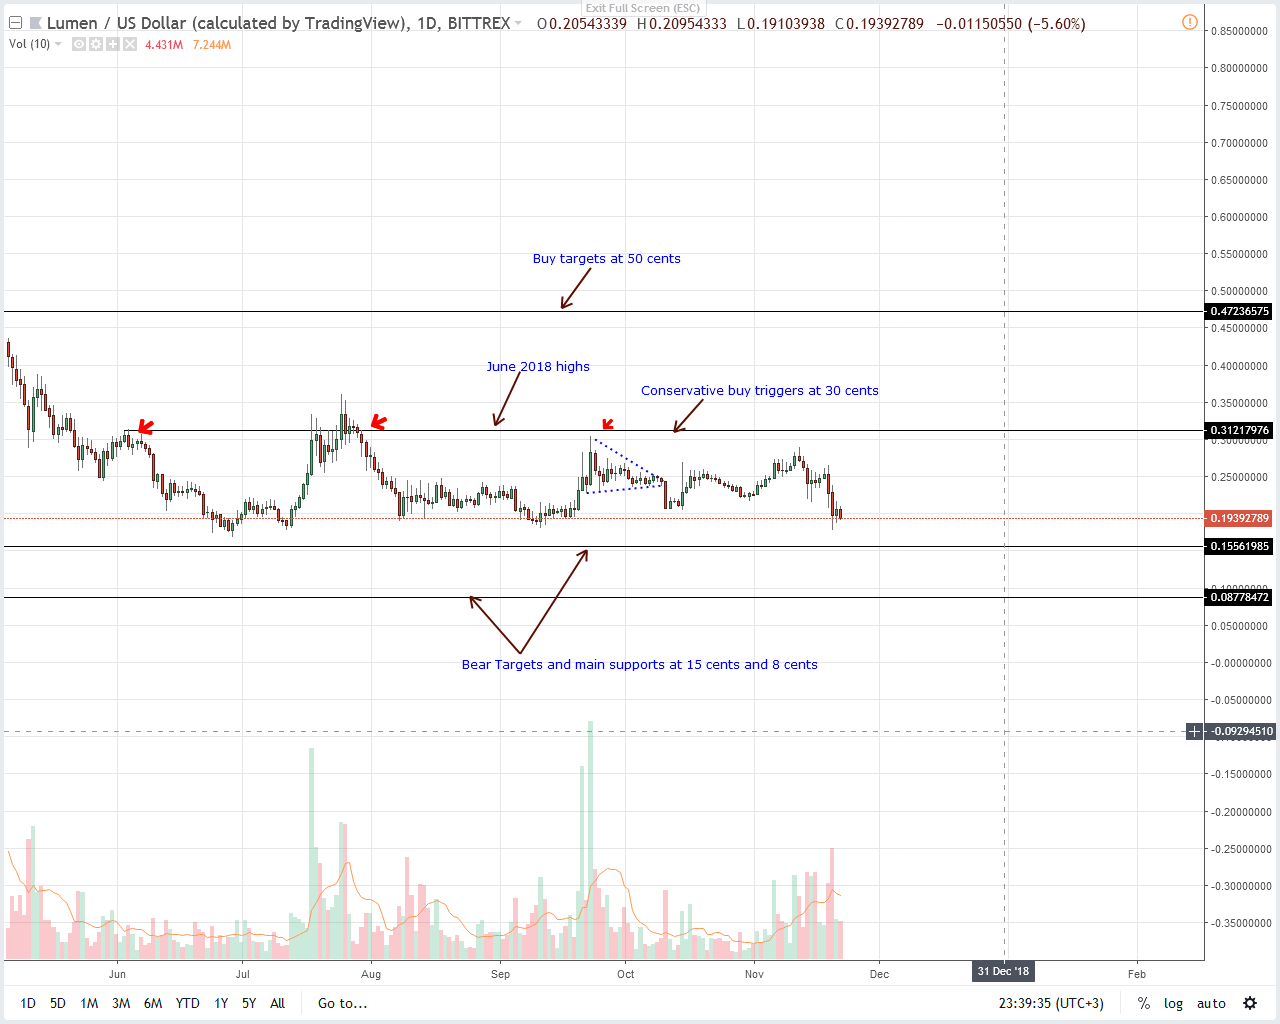
As long as XLM/USD is moving inside this 15 cents trade range with supports at 15 cents and resistance at 30 cents, our previous XLM/USD trade plan is valid. Notice that sell momentum is picking up thanks to Nov 19–20 high volume losses that reversed Nov 14-15 bulls.
Though we are optimistic of a recovery because prices are down +85 percent from 2017 peaks and Fibonacci retracement rules point to possible pull backs towards the 38.2 and 23.6 percent levels at around 30 cents and 45 cents, declines below 15 cents shall bin this forecast. Instead, prices could sink towards 8 cents.
TRX/USD Price Analysis
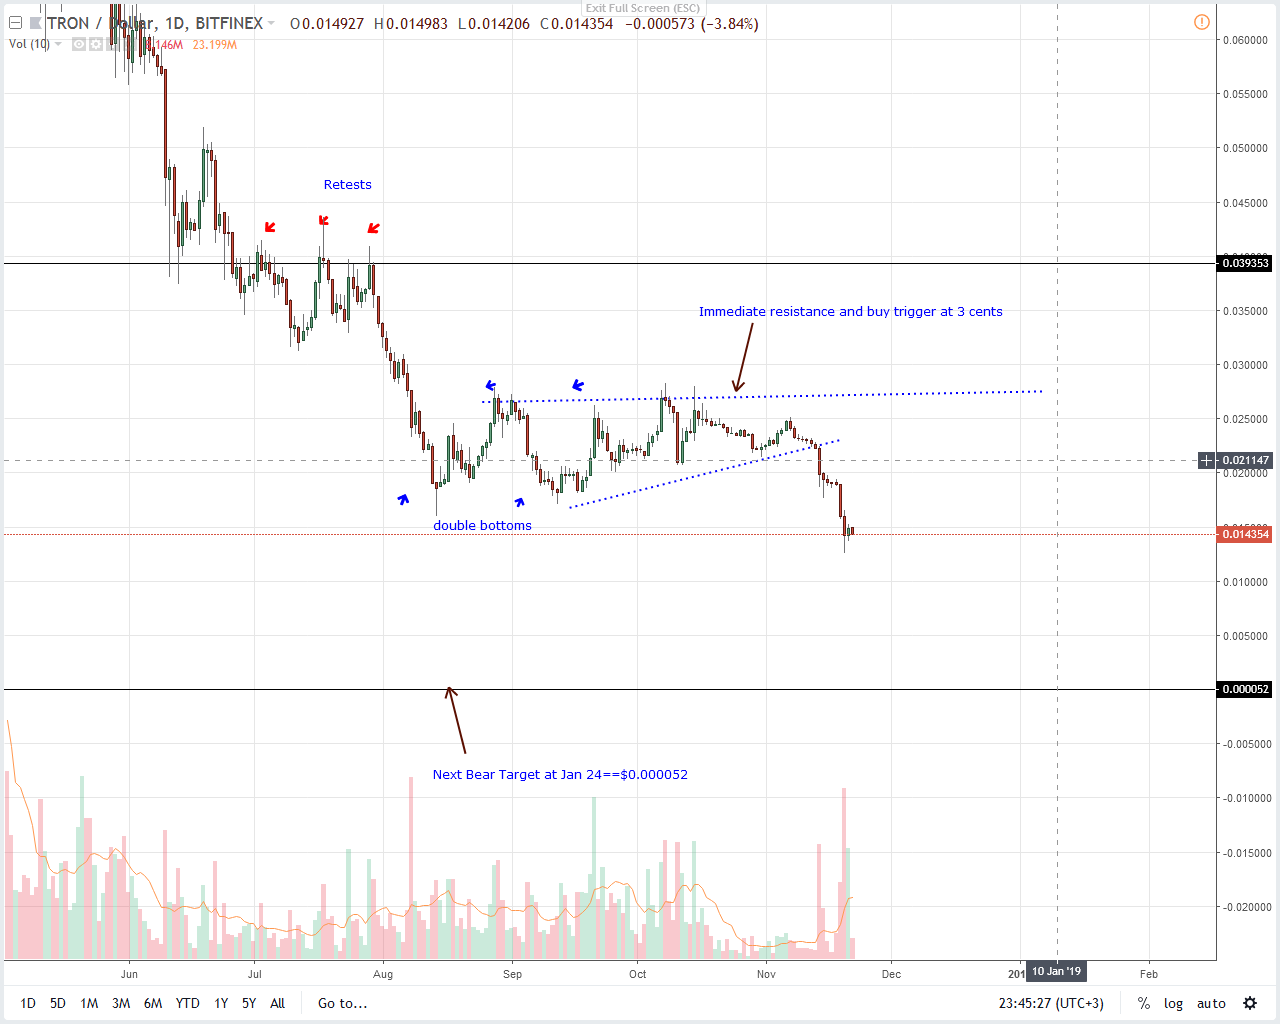
This week’s decline didn’t spare TRX and even with Justin Sun shills and superior transactions, TRX/USD is down 28 percent. TRX is still $250 million away from replacing Monero in tenth though the cap could widen if there are drops confirming the bear breakout below Aug lows at 1.5 cents.
Also Read: Gigantic Opportunities: Blockchain Capital Partner Touts Crypto Bullishness
From our previous TRX/USD price analysis, bears are definitely in control. Since our trade conditions are true, we suggest shorting at spot prices with stops at Nov 20 highs at 1.6 cents and targets at Jan 24 lows.
IOT/USD Price Analysis
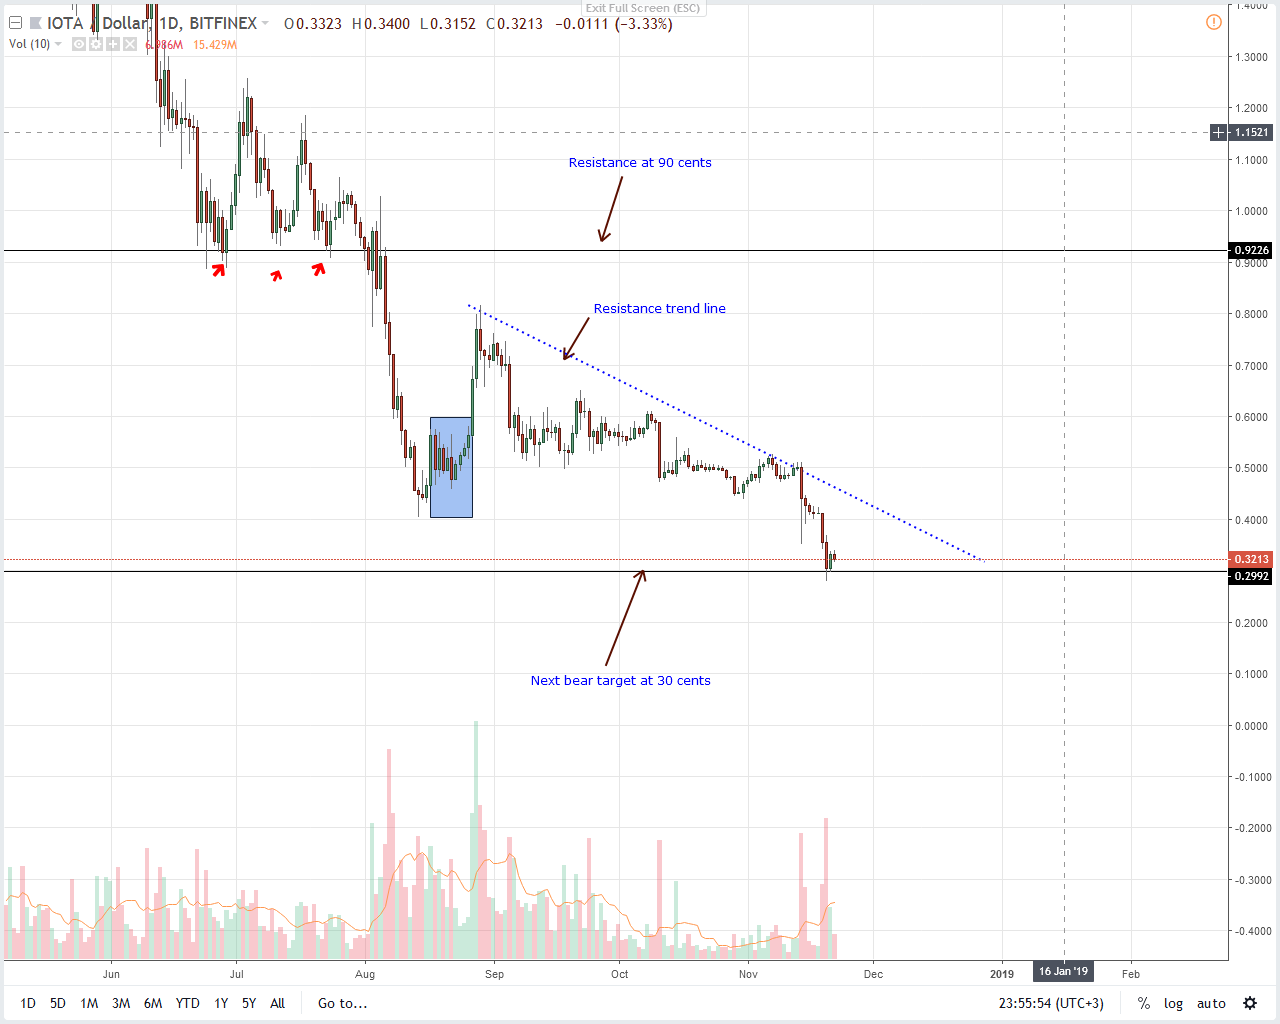
Technically IOT/USD is bearish and one of the top losers this week. IOTA is down 26 percent in the last week and with prices finding support at 30 cents, our first targets, we expect a follow through today. For our bull projection to be valid, we need to see strong surges above 50 cents and the main resistance trend line.
However, should there be retest and a sell signal print in lower time frame at or around the 45 cents—50 cents zone then investors should dump their longs and fade the trend with targets at 30 cents and later 20 cents.
All Charts Courtesy of Trading View
Disclaimer: Views and opinions expressed are those of the author and aren’t investment advice. Trading of any form involves risk and so do your due diligence before making a trading decision.


