While the equity markets are taking a huge hit today, the cryptocurrency market and Bitcoin (BTC) price are remaining relatively stable over the weekend and into the start of this week. As the stock market pulls back traders will begin to speculate on whether the crypto market will react in a bearish or bullish manner. Is this just the calm before the storm?
One thing to note is crypto trading volume has drained away over the past few days. With volume going down, perhaps this is a signal that a big move will take place in the market soon.
Crypto market daily performance. Source: Coin360
Bitcoin price holds $9.4K as a crucial support
The recent retest of the $9,400 support level wasn’t as bearish as many analysts feared as the level held for support and confirmed the support/resistance flip. However, the price of Bitcoin remains stable since, which is causing the volume to drain away.
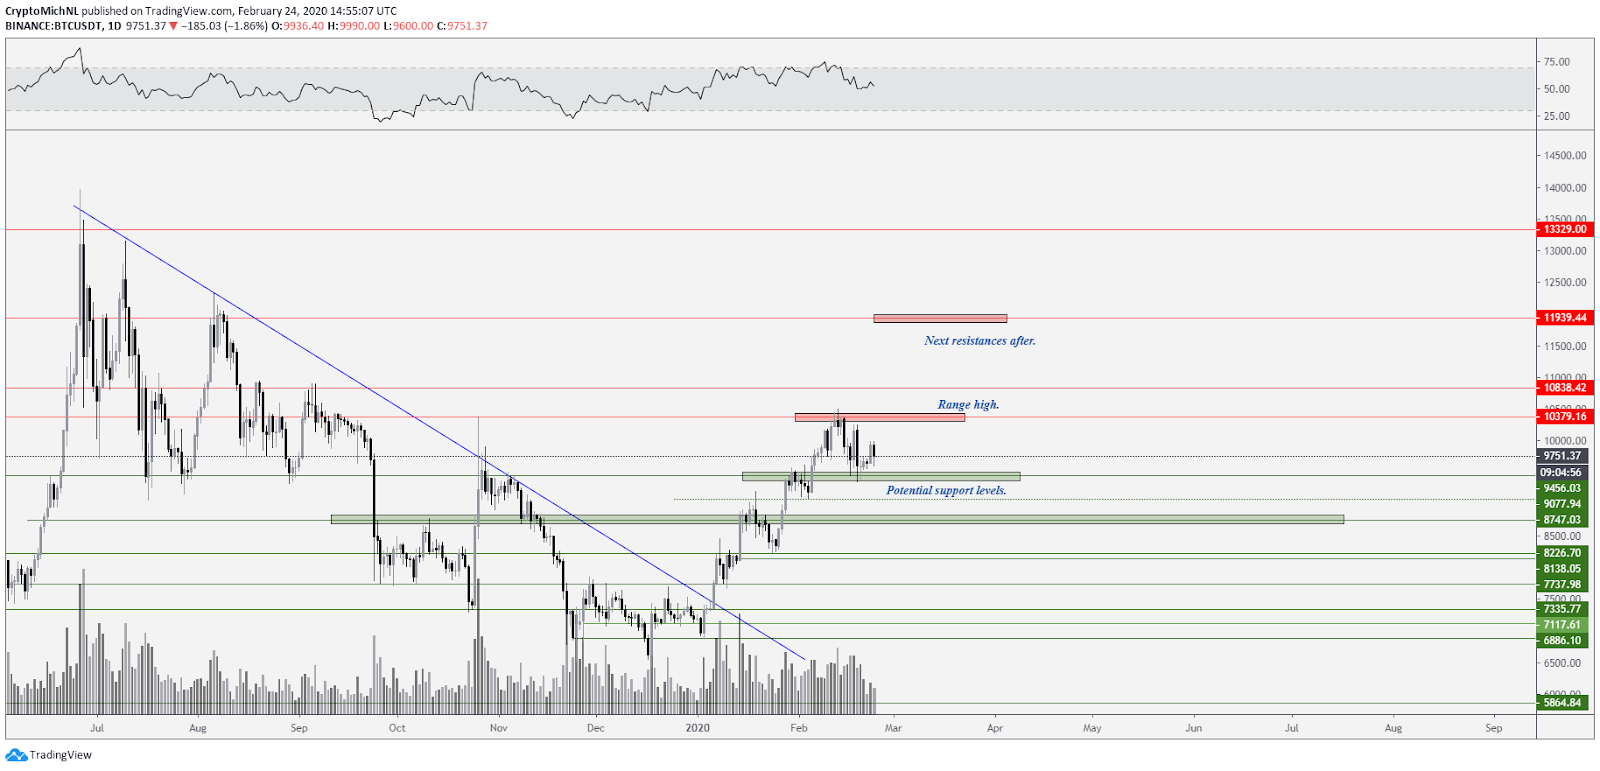
BTC USDT 1-day chart. Source: TradingView
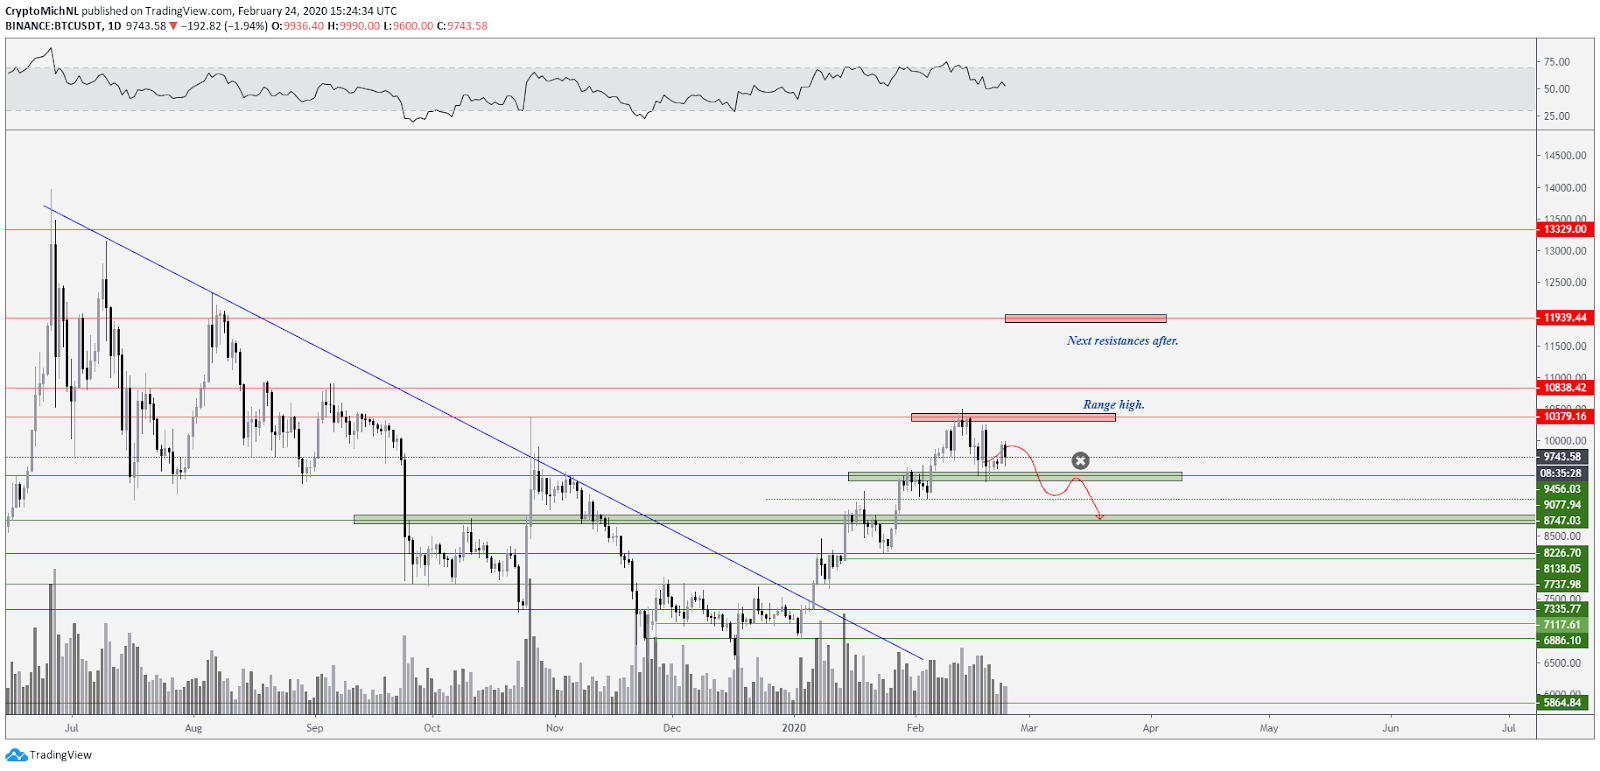
Bitcoin’s daily chart is showing a perspective similar to that of last week. The price is stuck within a range where $9,400 is the support and $10,400 is the primary resistance level to breakthrough. Currently, the price action is not giving a clear direction to the market.
However, the price moved from $6,900 to $10,400 since the start of this year and held the $9,400 level, which means that the price of Bitcoin is still trending upwards.
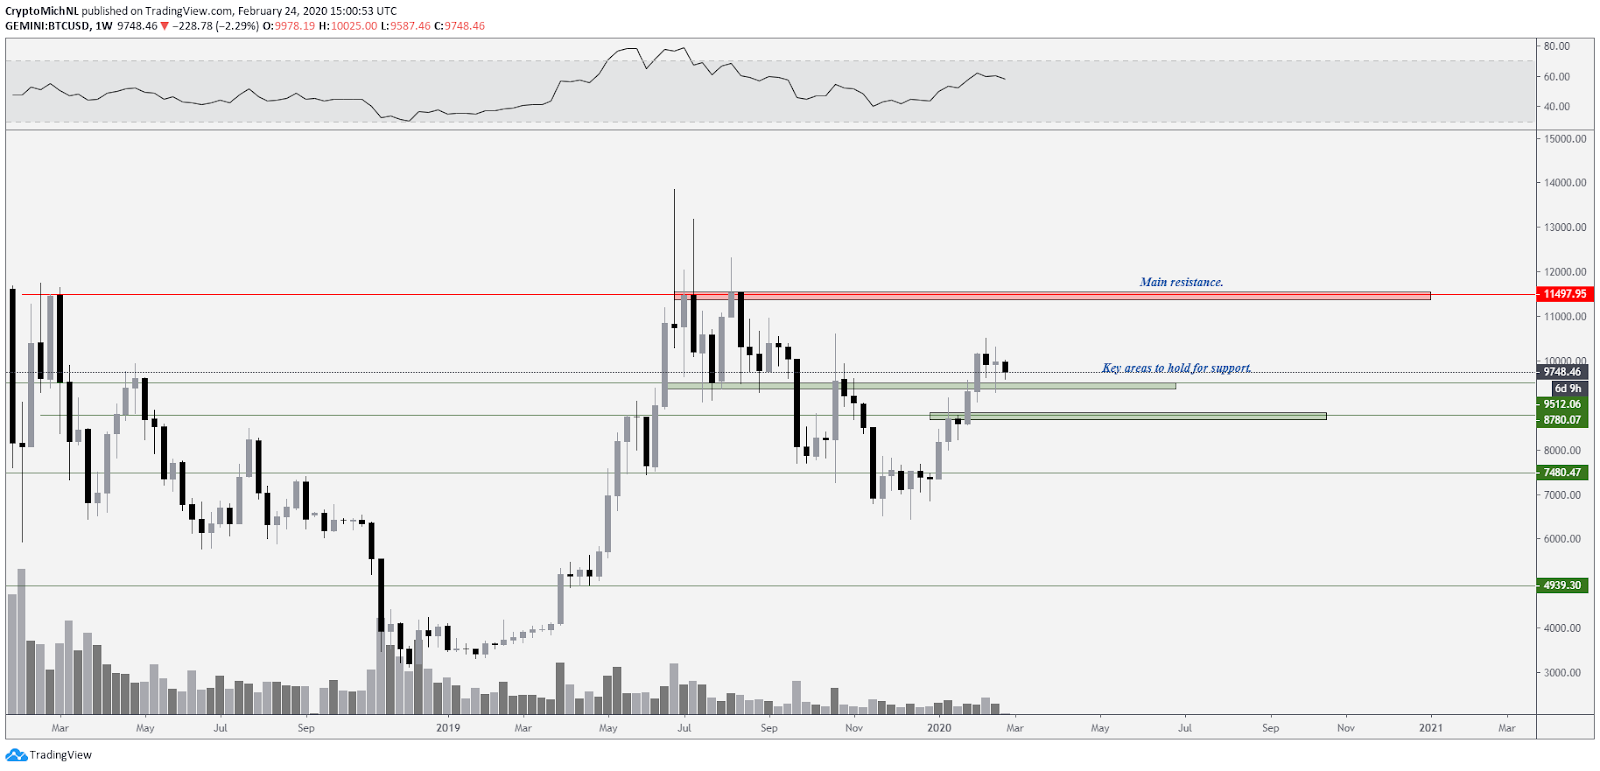
BTC USD weekly chart. Source: TradingView
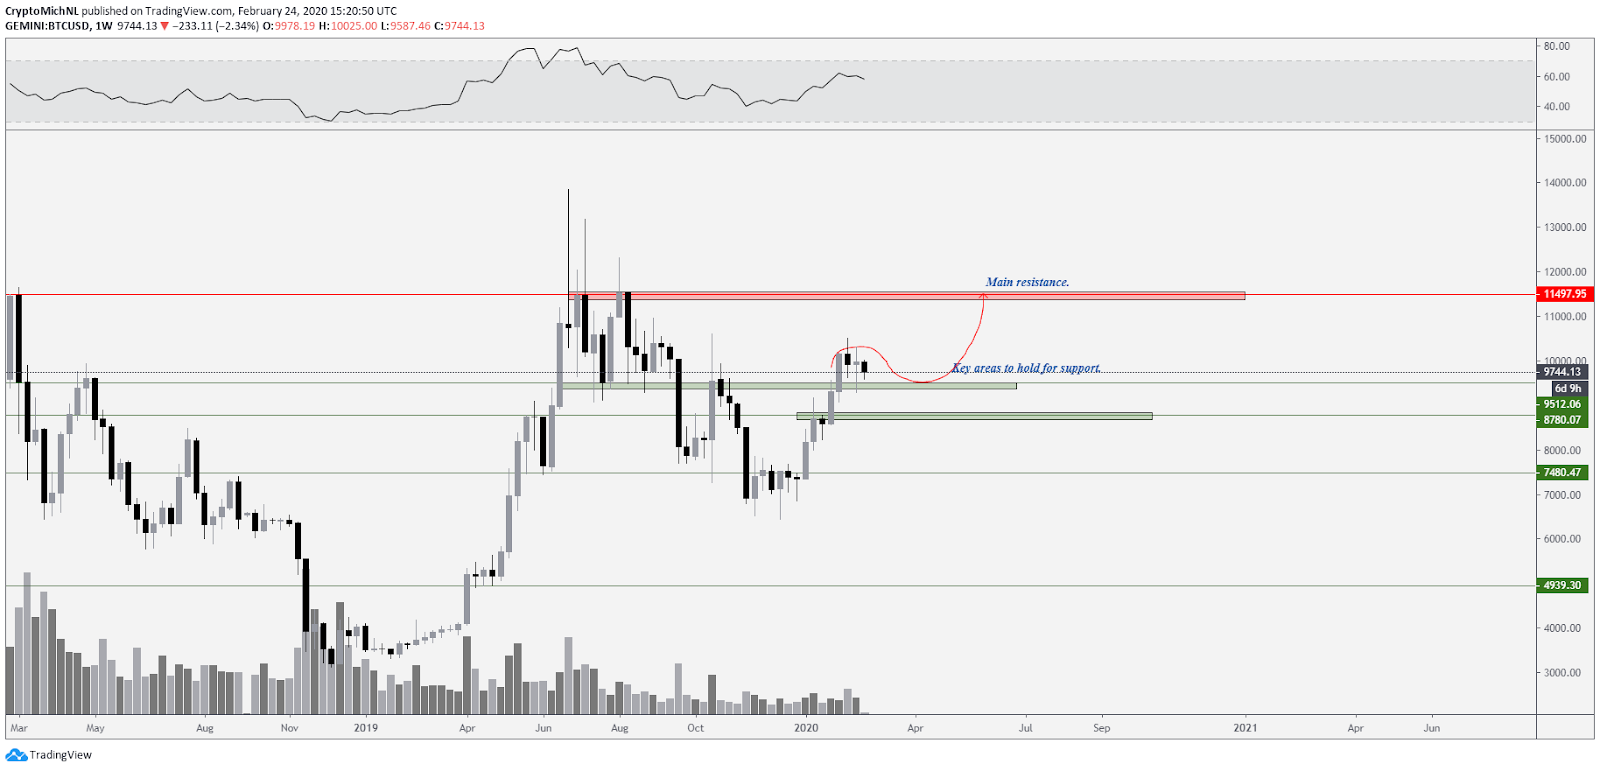
The weekly chart of Bitcoin also shows an encouraging outlook. The weekly closed above the crucial level of $9,500 and is currently stabilizing. Is this bearish? No, not in particular. The price of Bitcoin has moved about 50% in six weeks thus a retracement and period of consolidation are natural and healthy for a market before it continues.
The key areas to hold for Bitcoin are the $9,500 and $8,800 areas on the weekly timeframe. If the price of Bitcoin can sustain support above these levels (preferably $9,500), a bullish continuation is still warranted.
The critical resistance ahead is the $11,600 zone, which similarly, still has a CME gap around this area too.
Shorter timeframes show a downward trend
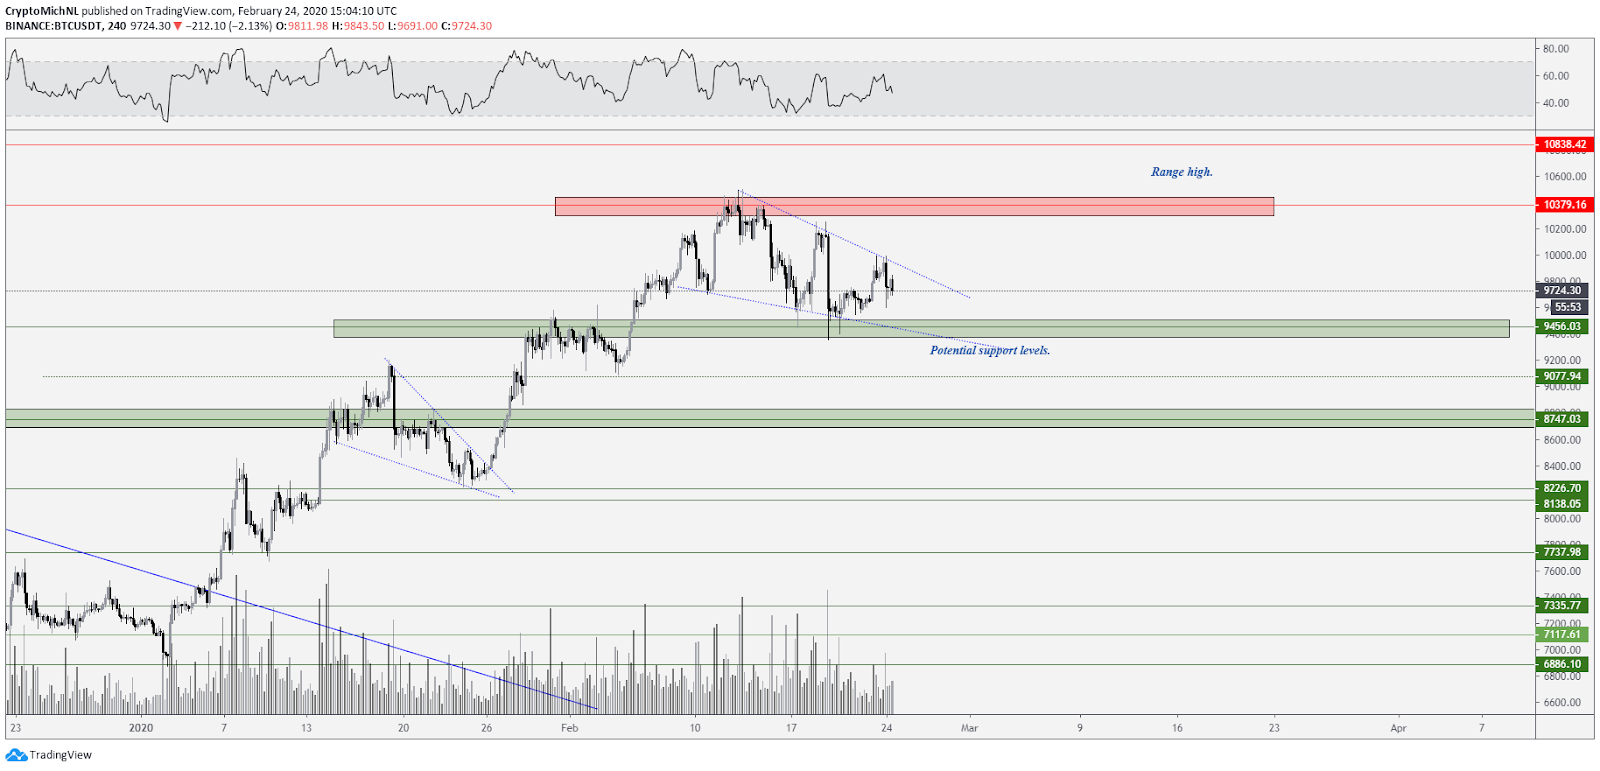
BTC USDT 4-hour chart. Source: TradingView
The 4-hour chart also shows a clear downwards structure in which the price is searching for support levels before continuation is sustained. Similar structures were found in the previous run-up in January 2020.
Through this, it’s easy to assume that Bitcoin price will maintain this range for a little longer.
Total market capitalization shows strength
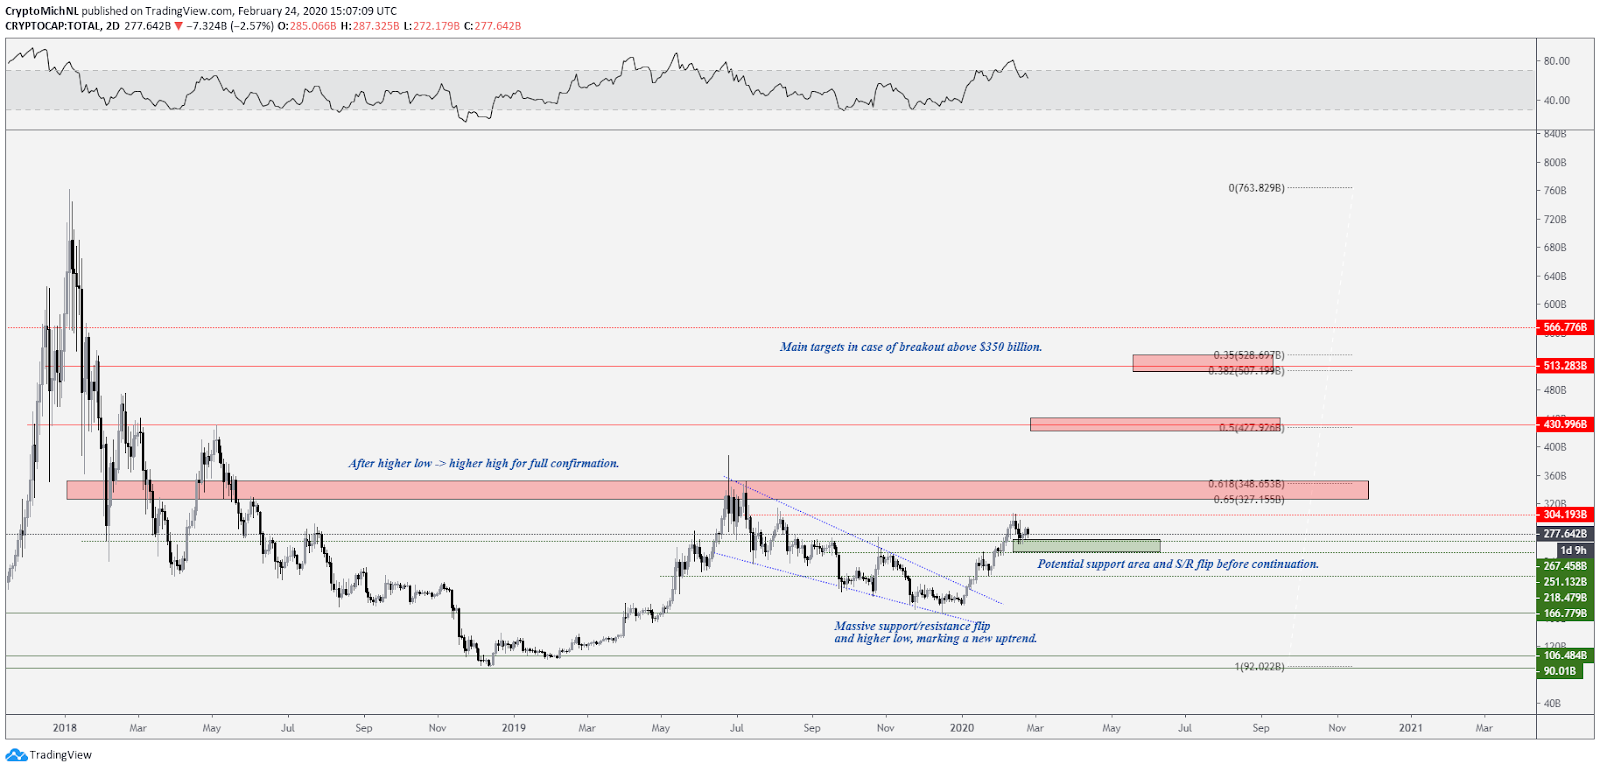
Total market capitalization cryptocurrency chart. Source: TradingView
The total market capitalization is showing a healthy pullback from the $300 billion resistance into the green area between $250 and $270 billion. The chart does not show a bearish outlook for now but a drop below $250 billion would change this point of view. This would mean that an important support was lost, and further downward continuation would be warranted.
However, as long as the green zone remains supported, further upward continuation is likely to occur, and then the market will seek a higher high. A new higher high would warrant further confirmation of an up-trending market.
It would be critical for such a move to break through the $325-350 billion resistance, which will be tested if the $250-$270 billion support gets confirmed.
Altcoin market capitalization shows support at $91 billion
Total altcoin cryptocurrency market capitalization chart. Source: TradingView
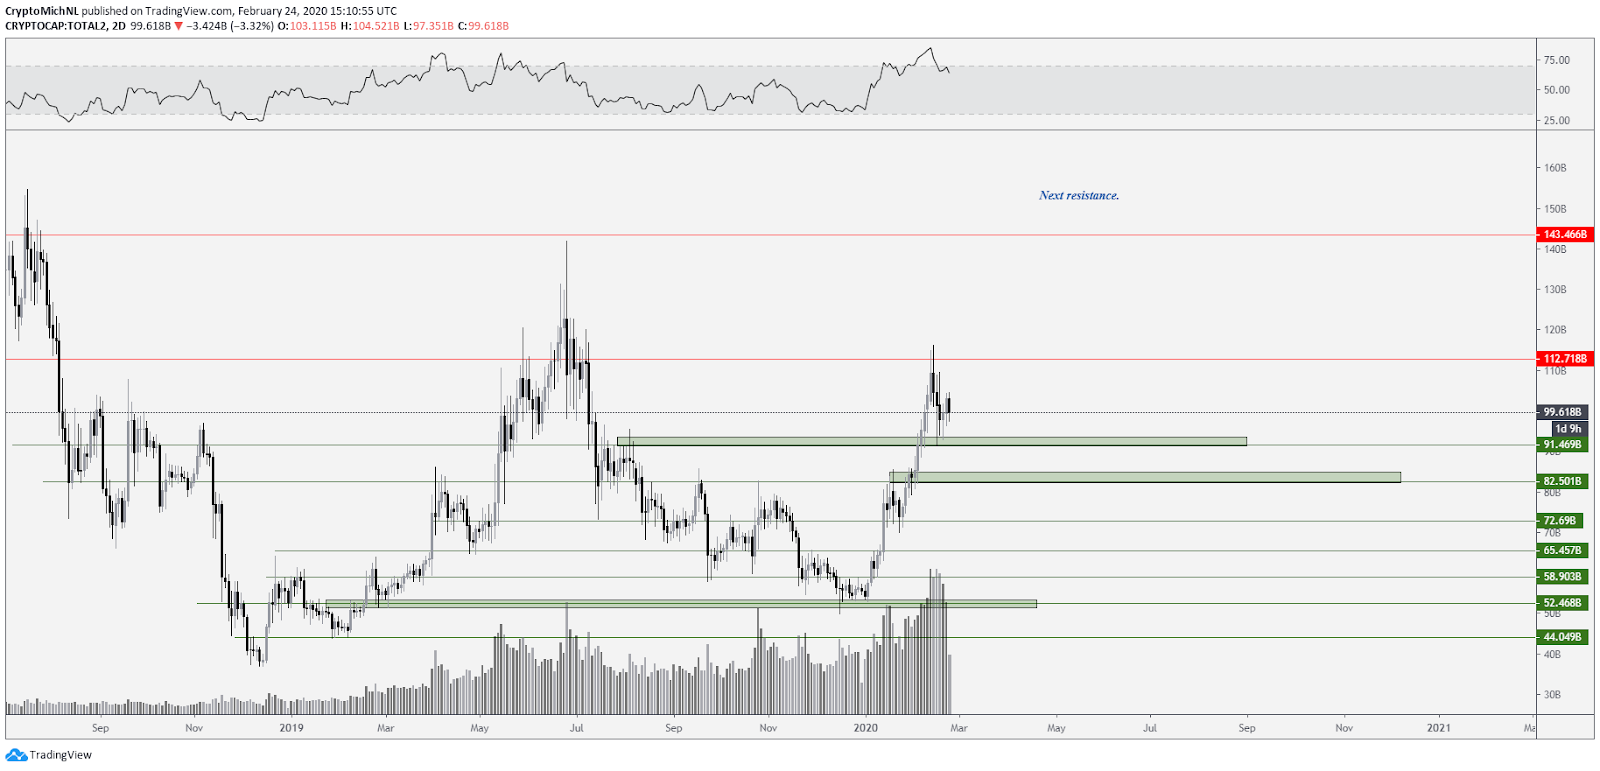
A similar outlook can be viewed on the altcoin market capitalization chart. Support is found at the $91 billion areas, through which consolidation started. Even a drop-down towards $82 billion wouldn’t be a bad outlook, as long as the total altcoin market capitalization doesn’t drop below that level.
As long as either of the two remain support, continuation upward is likely to occur. Such a move would grant a test of $112 billion levels and ss this level is tested again the resistance should start to weaken. The more times a level is tested, the weaker it usually becomes.
If the $112 billion level breaks, continuation towards $140-150 billion is on the tables for the altcoin market capitalization.
Bitcoin’s bullish scenario
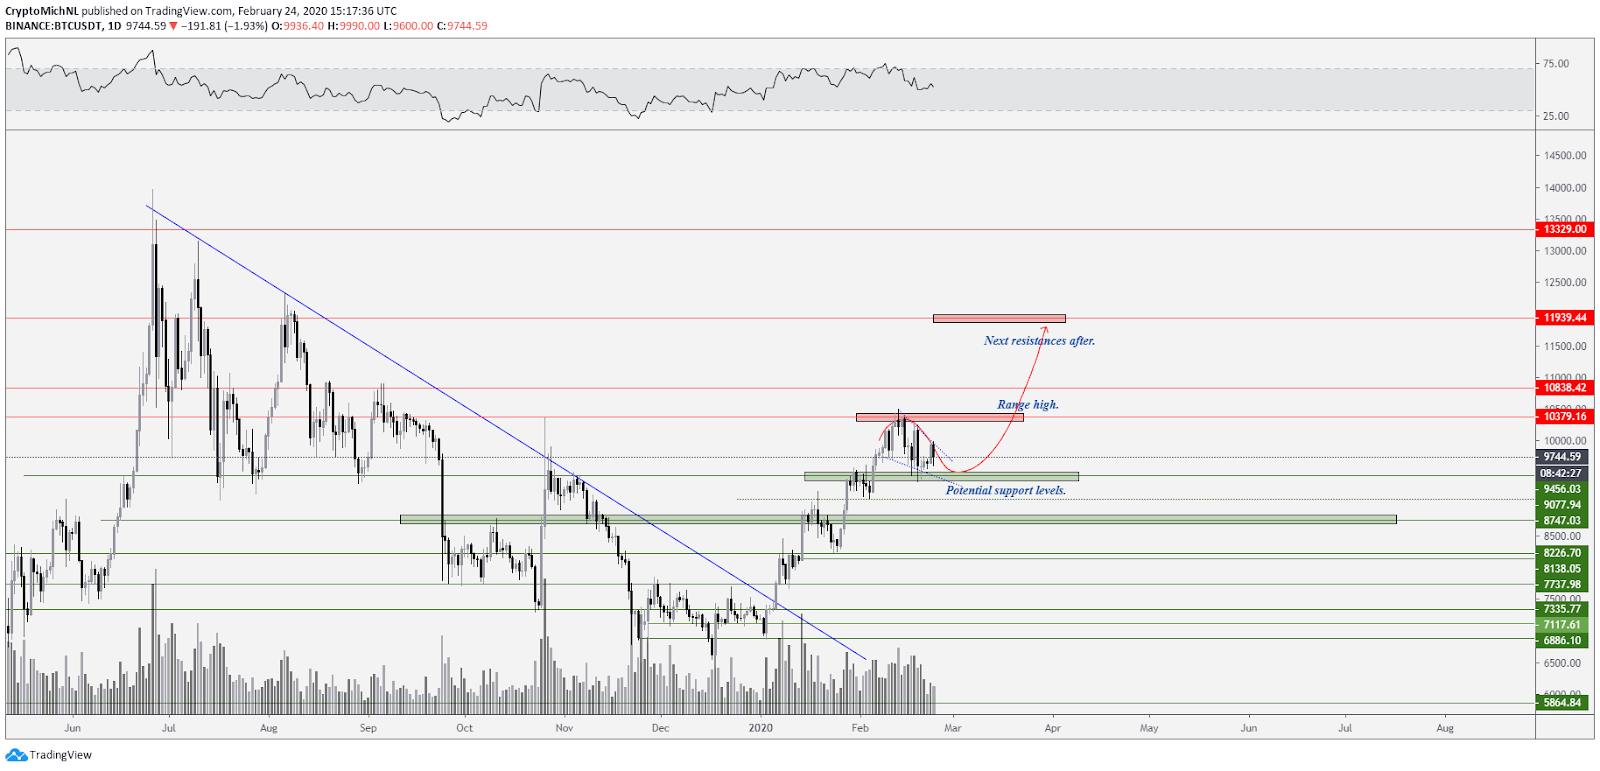
The bullish scenario is the same as the previous analysis and follows the described scenario. As long as the price of Bitcoin maintains above the $9,400 support area, the bullish momentum and trend are continuing.
Holding the $9,400 support area can even grant continuation towards the next resistance at $11,000 and $11,600-11,900. However, such a move could take some time before it starts to happen, as the price is currently range-bound between two levels.
As long as price remains sideways between $9,400 and $10,400, the volume and volatility will remain muted.
BTC USD weekly bullish scenario. Source: TradingView
The weekly chart also brings the focus back to the $8,500 and $9,500 levels as well. A drop towards $8,700 could even warrant continuation upwards. However, the longer the price sticks between $9,400 and $10,400, a dropdown below $9,400 would usually lead towards downward continuation.
This makes me believe that holding the $9,400 level is crucial in order to expect further upward momentum.
Bitcoin’s bearish scenario
BTC USD 1-day bearish scenario. Source: TradingView
The bearish scenario is pretty straight-forward. If the price of Bitcoin can’t hold the $9,400 level for support, a continuation downwards is likely.
However, the price of Bitcoin could sustain inside this range for a while. If the price can’t make a new higher high (like rejection at $9,900), a dropdown below $9,400 is a serious possibility.
Key signals to watch for would be a weak bounce from the $8,750 level. If the price of Bitcoin bounces at $8,750 and can’t break back above $9,400, a bearish rejection and confirmation are given. This rejection will grant continuation towards $8,000 and perhaps lower.
The views and opinions expressed here are solely those of the author and do not necessarily reflect the views of Cointelegraph. Every investment and trading move involves risk. You should conduct your own research when making a decision.


