Bitcoin price is back above $50,000 after a short-lived correction in the range below the key level. However, since the cryptocurrency has reclaimed the halfway point to $100K, open interest has skyrocketed.
The sudden sharp increase in open interest has traders cautious currently. Here’s a closer look at why that’s the case and what could happen as a result.
Open Interest Climbs Alongside Bitcoin As It Surpasses $50,000
Bitcoin is still reeling from the whale-included selloff at $58,000, that sent the cryptocurrency dropping by 20% in just days. The leading cryptocurrency couldn’t sustain above a $1 trillion market cap, despite making it over the milestone temporarily.
Related Reading | Bid Side In Bitcoin Disappears Amidst Jittering “Macro Environment”
Price action is now back above $50,000, but on the way up, the market has added what one pseudonymous crypto trader says is “tons” of open interest.
Open interest has surged since the break back above $50,000 | Source: hyblockcapital.com
According to the trader, this suggests that others have taken long positions on the way up expecting a sizable price increase. An increase in leveraged positions could provide enough fuel for a deeper correction, if long positions are forced to cover amidst a stronger wave of selling.
Markets often take the path of maximum pain, which could result in a cascade of long liquidations on the way further downward.
The Many Reasons Why Crypto Traders Must Proceed With Caution
Bitcoin is in an uptrend, and according to Dow Theory, should be considered in an uptrend until the market says otherwise. But all bull cycles do come to an end, and that finale could arrive at any time.
Traders should currently be cautious of a long squeeze as highlighted above, but technicals are starting to show signs of exhaustion.
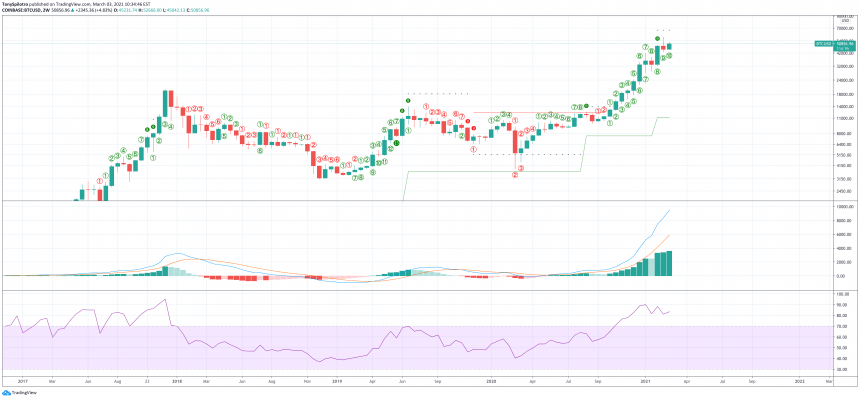
Technicals could also point to a larger correction in Bitcoin | Source: BTCUSD on TradingView.com
A TD Sequential TD 9 sell setup on the not-oft-used two-week timeframe has triggered two candles ago. The TD 9 acted as the exact top in 2019, and after appearing in 2017, took exactly two candles before the reversal arrived.
Related Reading | This Unique Take On Bitcoin Suggests A Bear Phase Is Near
Here it is, another two candles past the TD 9 sell setups appearance, after a red doji, and during the bloodiest month in Bitcoin’s history. The current two-week candle has more than ten days left to go, and if it closes red and below $40,000 per BTC, an evening star bearish pattern will have formed.
An evening star pattern after a TD 9 while the MACD and RSI are at record overbought levels could mean a sizable correction is due. With open interest so high, there are plenty of reasons why traders must proceed with caution.
Featured image from Deposit Photos, Charts from TradingView.com


