Last Friday Bitcoin (BTC) price marched within just a few dollars reach of $11,000 and it seemed that the weekend would be a bullish one. The top digital asset was on the verge of leaping over the descending trendline of the massive wedge. A mysterious $1 billion Bitcoin transfer spotted by Whale Alert had some speculating that a whale or an institutional investor was moving funds into Bakkt’s custody service.
Shortly after topping out at $10,938, Bitcoin sharply reversed course and traders were left to speculate whether Federal Reserve Chairman Jerome Powell’s Bitcoin comments put a damper of the bullish price action. Or perhaps the advent of Bakkt’s (physically delivered) Bitcoin futures contracts was repeating the CBOE/CME Bitcoin futures product that launched to much hype right at the peak of the 2017 monster rally.
Let’s take a look at the current price action and see if we can determine what Bitcoin is up to.
BTC USD Daily Chart. Source: TradingView
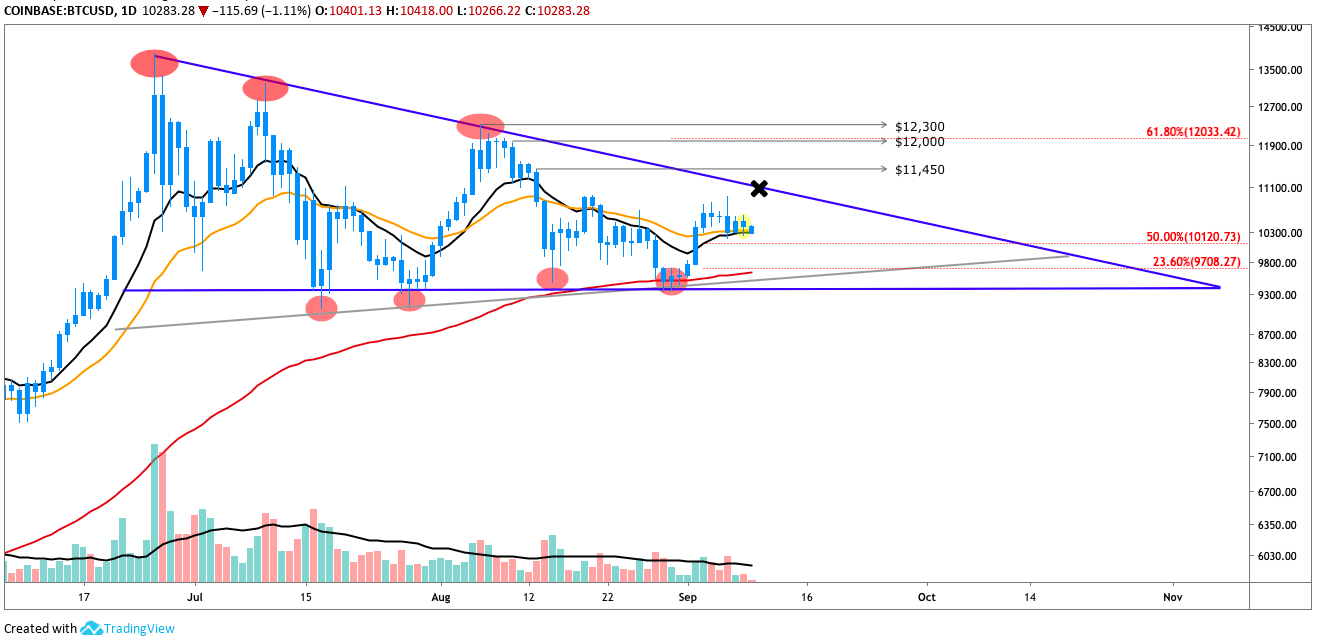
The recent move from $9,350 to $10,800 brought Bitcoin price above the 50-day MA. Previously, it was pinned between the 50 (black) and 100 (orange) day MA.
As BTC made a strong run at $11,000, a spike in bear volume crushed BTC but buyers stepped in and absorbed the dump. BTC is maintaining the range it’s been in for the last week abd $10,500 now acts as resistance whereas previously it functioned as a support.
BTC USD Daily Chart. Source: TradingView
The 12 EMA (black) and 26 EMA (orange) are also on the verge of converging and a move to $11,000 brings BTC right against the upper trendline of the wedge.
$11,091 (X) could act as resistance and a spike in bull volume could push BTC as high as $11,450.
A move to $12,033 would place Bitcoin at the 61.8% Fibonacci retracement level from the $13,800-$9,067 retrace.
If BTC price breaks below this point, there is soft support near $10,250 — a point which also lies near the 50% Fibonacci retracement level.
BTC USD Weekly Chart. Source: TradingView
Short term bearish but long term market structure and sentiment are bullish
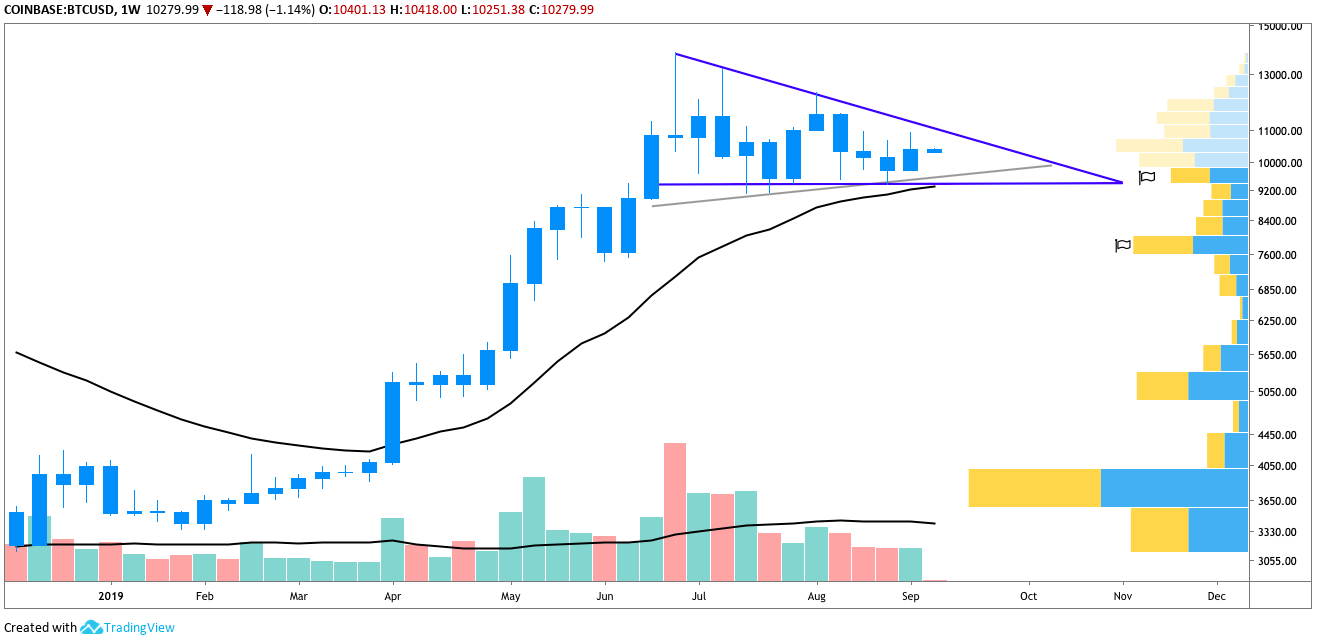
On the weekly time frame, BTC regained the 12 EMA as support and on lower time frames it is trading between the two moving averages. Some would say a dip below the 26 EMA opens up the door to bears but keeping an eye on the longer time frame, one remembers that the 111 EMA, 128 EMA, and the 20 weekly MA (black) have served as reliable bounce points when BTC turned bearish.
Bitcoin closed the week above the 20-WMA and has put a little space between each other but the weekly moving average convergence/divergence (MACD) in now in its second week of a bear cross with a negative histogram.
BTC-USD Weekly MACD. Source: TradingView
Longs vs. shorts
BTC-USD BitMEX Longs vs Shorts Daily Chart. Source: TradingView
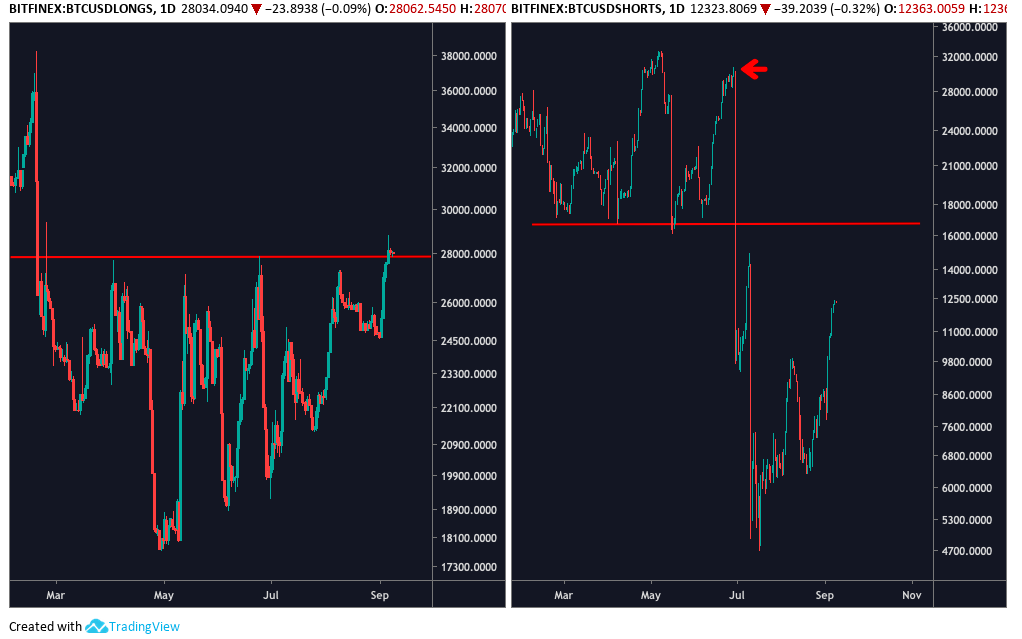
As shown on the BTC/USD Longs daily chart, bulls have tested the resistance line 27,900 on multiple occasions and as BTC gathers momentum, it looks as if this point could be conquered at some time later on.
BTC/USD Shorts on the other hand, have ample room to keep moving upward and we can see that it is Longs that are piling into leveraged positions at a higher rate than shorts.
Sentiment wise, Bitcoin remains bullish and the macro market structure still has the potential to lean toward bulls.
Bearish scenario
As the Bollinger Bands tighten on the daily timeframe and BTC’s price range narrows to correspond with the narrowing descending wedge, Bitcoin could drop below the 20MA at $10,167. This could lead to a pullback to $9,469-$9,350, which would be a full retrace of last week’s action.
The Volume Profile Visible Range (VPVR) shows relatively stout purchasing demand around $9,500 and this begins to fizzle out near $9,300, which is below the base of the wedge pattern and the bottom Bollinger Band arm.
As a matter of last resort, $9,200-$9,100 would be the last support before an uptick in buying demand presents itself near $8,500. A drop to $9,300-$9,100 would be the third test of this support. Admittedly, no one knows if it will hold or give way next time around.
Bullish scenario
As mentioned previously, if Bitcoin price could set a higher high near $11,450 it would not only be encouraging, but would also bring the digital asset above the descending trendline of the wedge pattern.
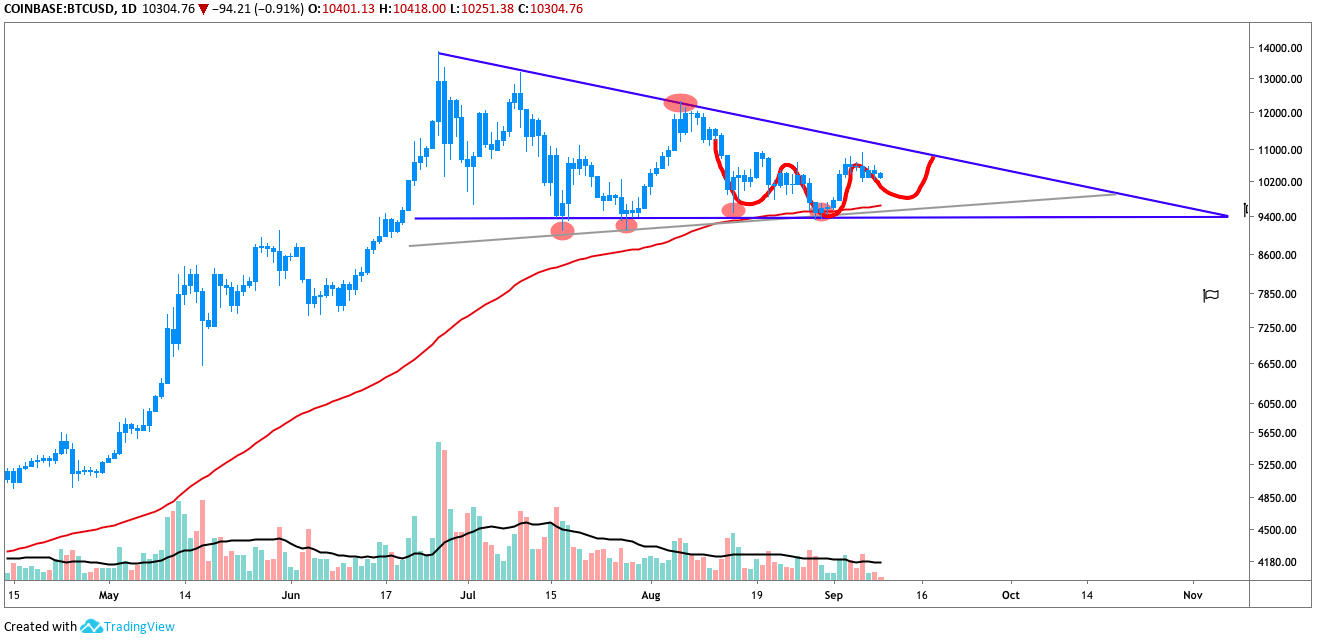
Furthermore, there appears to be a massive inverse head and shoulders (IH&S) pattern in play that originates from Aug. 12.
BTC USD Daily Chart. Source: TradingView
The IH&S has a neckline at $10,920 and this point conveniently aligns with the descending trendline of the wedge at roughly Sept. 18. As suggested previously, Sept. 15-Sept. 23 is bound to provide some excitement and Bitcoin volatile is likely to spike around during this time.
Alternatively, a bounce from $10,000 is not out of the question and Bitcoin has crossed the $10K mark at least 19 times in the past few months.
A drop to the 20-MA ($10,167), $10,000 or even $9,450 could stir up enough demand to bring Bitcoin right back to $10,800 as this would simply follow the current pattern of consolidation within the wedge.
Though, it must be said that once breached, the 20 MA of the Bollinger Band indicator frequently flips from support to resistance. Bitcoin’s current struggle to cross above $10,500 on the 4-hour chart is indicative of this.
If Bitcon drops below $10,167, then this point is likely to become resistance and the lengthy pattern of lower lows within the wedge pattern also support the possible trend.
Ultimately, it’s anyone’s guess where Bitcoin goes from here. Obviously time will tell and the fact that BTC is tightening, along with the Bollinger bands within the narrowing wedge means BTC is fast approaching a decision point.
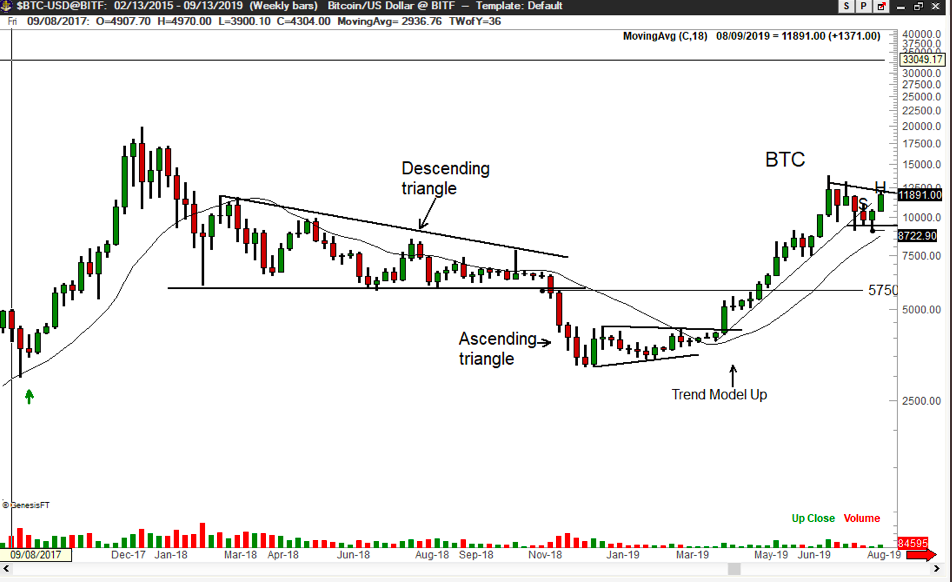
Over the weekend veteran trader Peter Brandt tweeted the following chart and said:
“Bitcoin meets the definition of a descending triangle. Don’t let newbie chartists tell you different. Right-angled triangles imply (but do not demand) a resolution thru the horizontal boundary.”
Traders are advised to keep a close eye on volume as it continues to drop off but we all know volume precedes price.
As BTC tightens and volatility becomes more restrained, keeping a close eye on the order books across the largest exchanges and Bitcoin’s volume could be provide valuable insight into which way the asset will break.
The views and opinions expressed here are solely those of the author and do not necessarily reflect the views of Cointelegraph. Every investment and trading move involves risk. You should conduct your own research when making a decision.


