As Bitcoin’s (BTC) price has been consolidating in recent weeks, many other crypto assets started to show strength. This was largely expected since altcoins generally do better once BTC cools down.
Lower volatility in Bitcoin means higher volatility for altcoins as the money flows from Bitcoin to altcoins. Ether (ETH), for example, is now looking to break its all-time high almost a month after Bitcoin’s surpassed its own milestone.
However, one of the biggest gainers in recent days is Yearn.finance (YFI), which is approaching its own all-time high at $47,000, and whose rally is also being boosted by the launch of a new upgrade, namely v2 Vaults.
Expect more iterations to come, but we finally feel ready to open it up and support you apes with this new design.
— I’m just a doggie boi (@fubuloubu) January 18, 2021
Let’s take a look at the technicals and see if the all-time high may get broken in the next few days.
The $44,000 ATH could break in the near future
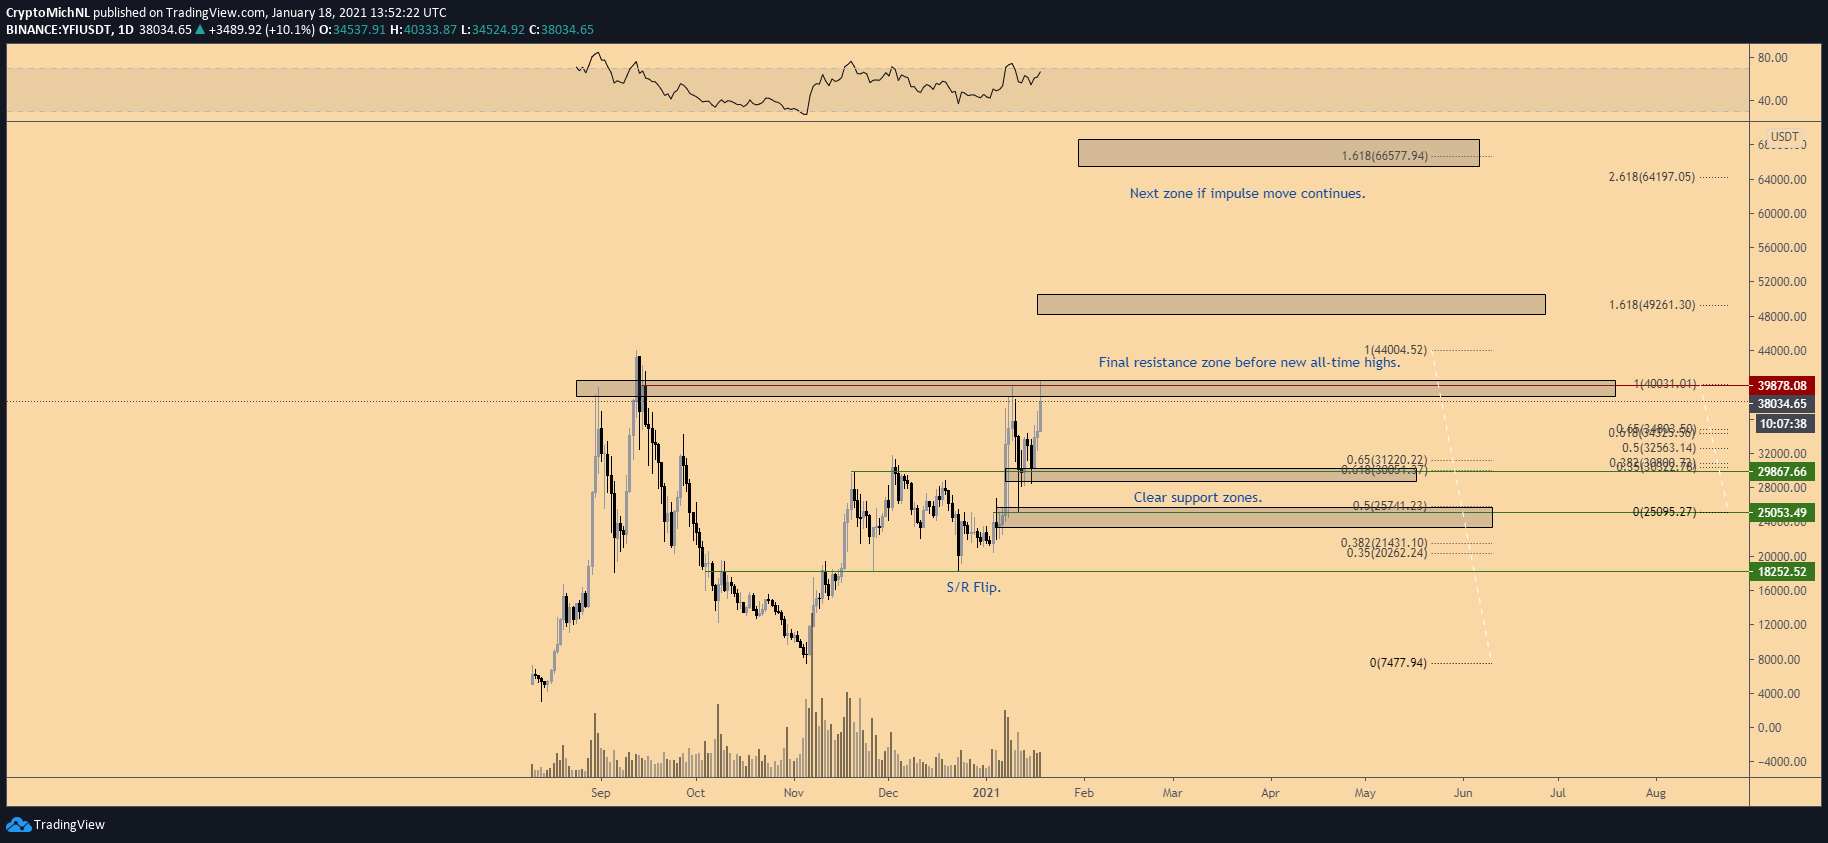
Yearn.finance is showing strength in the USD pair, approaching a new all-time high. However, the current resistance is the final hurdle before this level can be broken.
The chart in itself shows a clear support/resistance flip of the $18,250 level. This support/resistance flip generated further momentum toward the $30,000 barrier.
This $30,000 barrier finally broke at the beginning of January 2021, as the price of YFI accelerated to the $40,000 resistance zone. As long as the $30,000 level sustains support, for now, further upside is likely.
A potential rally to $66,000 is on the horizon

I’ve recently discussed the Fibonacci extension tool as a magnificent indicator to use for further projections of price movements. This indicator can be used on Yearn.Finance as well, as YFI’s price might continue running into price discovery.
Price discovery can be hit once it breaks the crucial $40,000 resistance area. However, the next pivots can be found via the Fibonacci extension tool at $55,000 and $66,000.
These areas are determined through the 1.618 Fibonacci level, with $66,000 being the most pivotal area. This level of interest is defined by the entire corrective move from $44,000 to $7,500.
If the 2.618 Fibonacci level is used to determine the upside target (and this level is also often used, depending on the strength of the market), then $100,000 or higher is achievable for Yearn.finance.
The BTC pair has a lot to regain

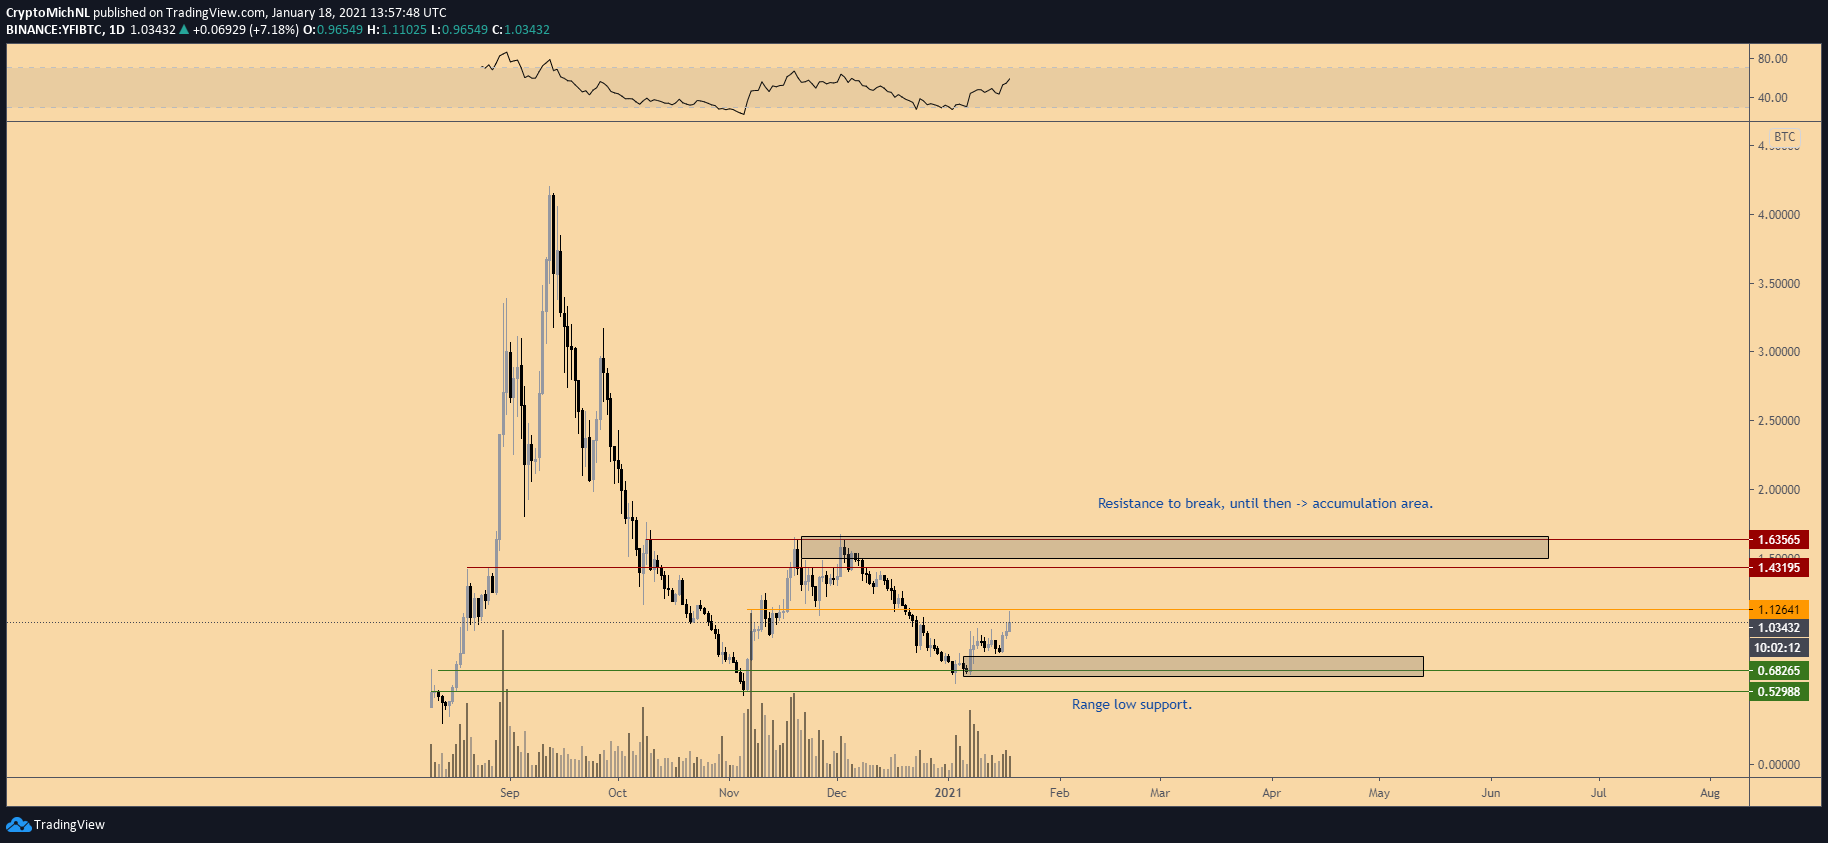
The daily chart of Yearn.finance against BTC shows a clear downwards pattern similar to most altcoins in recent months.
Most of them are consolidating in the BTC pair while accelerating heavily in the USD pair. Some are reaching new all-time highs in USD value, while the BTC pair is still hovering around the current cycle lows.
Therefore, a bullish outlook for YFI/BTC is questionable at this point. First of all, the 1.12 BTC level needs to break through the upside, which means the next resistance zone is at 1.40-1.65 BTC.
At 1.40-1.65 BTC, the resistance zone is the critical resistance to break and could be classified as the accumulation range high. As long as Yearn.finance moves between 0.68 and 1.40 BTC, the cryptocurrency is in accumulation mode.

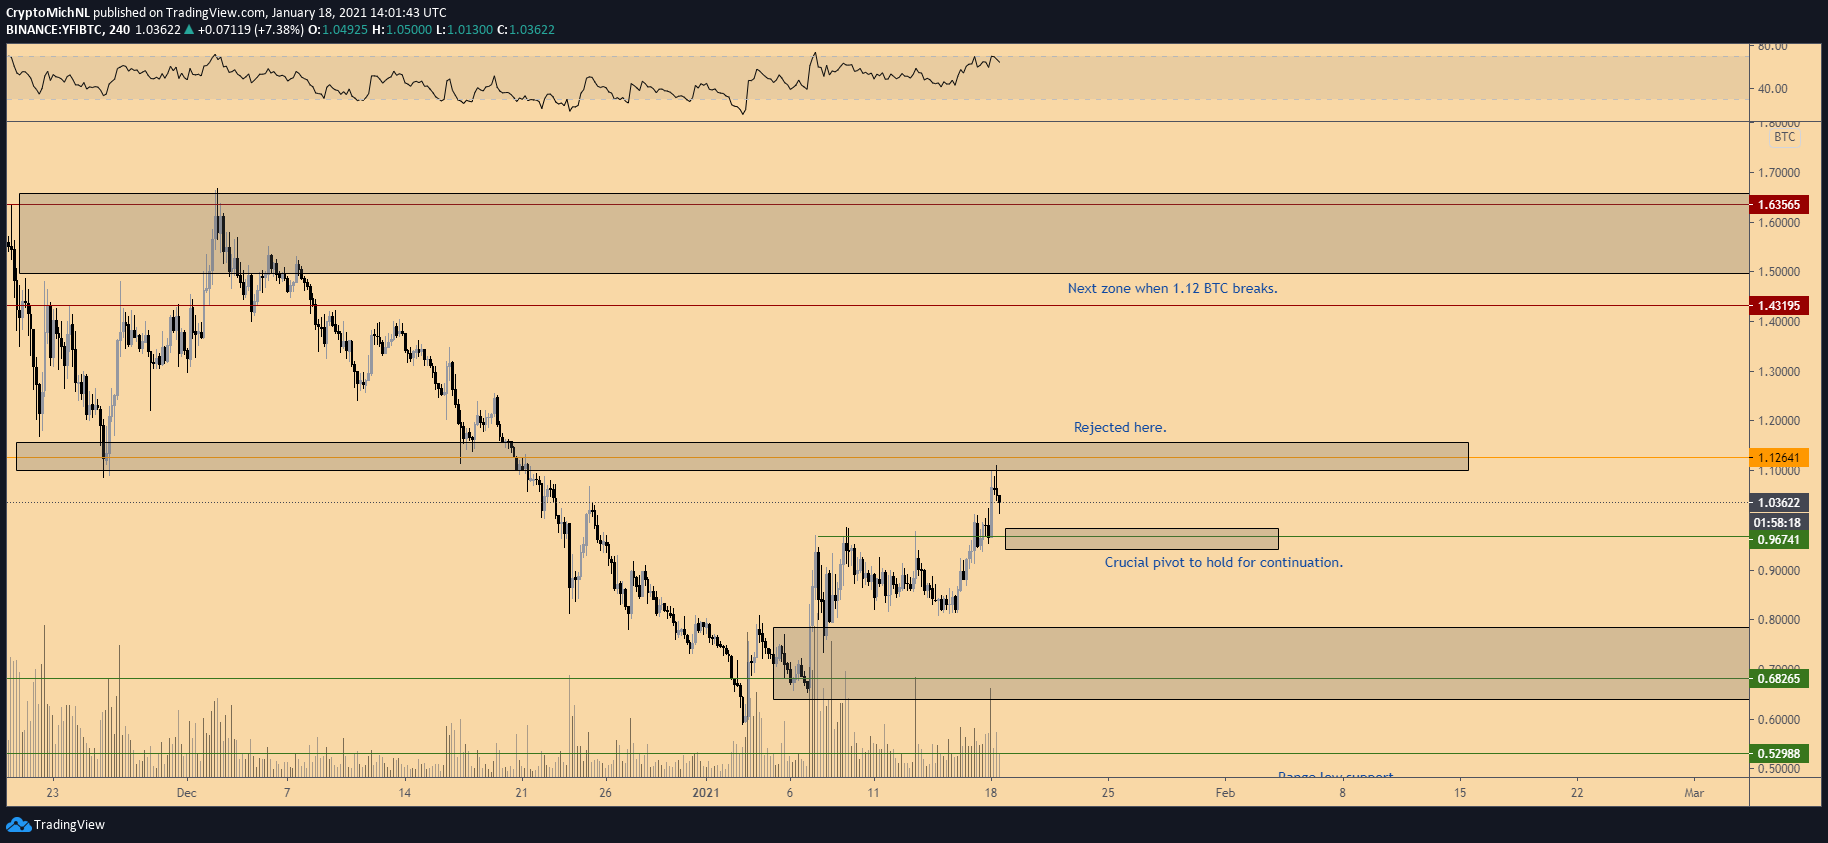
The 4-hour YFI/BTC chart shows a breakthrough of the 0.96 BTC level. However, the 1.12 BTC level is currently acting as resistance.
This level has to break to see more upside toward the next pivotal resistance area at 1.40-1.65 BTC. If this level fails to break for resistance, the 0.96 BTC area has to sustain support to justify further tests of the 1.12 BTC resistance area.
However, if weakness is shown and 0.96 BTC fails to hold for support, more downside is likely, and a renewed retest of the 0.68 BTC level could happen.
In that regard, YFI/BTC would still be acting inside the accumulation range until Bitcoin starts to consolidate, and more money flows into altcoins.
The views and opinions expressed here are solely those of the author and do not necessarily reflect the views of Cointelegraph. Every investment and trading move involves risk. You should conduct your own research when making a decision.


