The price of Bitcoin (BTC) dropped to as low as $8,600 on May 25 as retail investors on Coinbase led an abrupt short-term downtrend. The price has since fluctuated between $8,800 and $9,200, demonstrating high volatility in a tight range.
Bitcoin is currently at a decisive point where it could fall back below the $8,000 support level and retest lows in the $6,000–$7,000 range or break above $10,500 and initiate a new bull cycle.
Top crypto traders remain mixed on the current trend of Bitcoin. Some believe BTC is heading down to at least $7,100. Such a drop would stabilize the market and establish a stronger foundation for BTC to rally. Others foresee one to two weeks in the low-$9,000 region before a breakout above $10,000 and surge to potentially $14,000, $17,000 and $20,000 in the medium term.
Bullish scenario for Bitcoin
The bullish scenario for Bitcoin in the near term is quite simple. BTC has to surge above $10,600 to surpass its previous peaks in October 2019 and February. For a new bullish uptrend to materialize, BTC has to maintain its momentum above $9,000 and grind to surpass $10,600, eventually establishing a peak above the $11,000 resistance level. The Bitcoin options trader known as Theta Seek wrote:
“Been seeing alot of bearish tweets, but I think that this is the last 1-2 weeks that you’ll EVER be able to buy #BTC under $9K.”
If the price of Bitcoin remains above $9,000 until June 1 and achieves a monthly close above mid-$9,000, it would increase the probability of a sizable rally heading into the third quarter.
One significant data point that supports the theory of bulls is the reluctance of Bitcoin holders to sell. In the last two months, the price of Bitcoin almost tripled from $3,600 to $10,080. Yet on-chain data shows that investors are unwilling to sell at that price. Cryptocurrency analyst Philip Swift said:
“60% of all Bitcoin has not moved on the blockchain for at least 1 year. This is an indication of significant hodl’ing. The last time this happened was in early 2016, at the start of the bull run.”
Hodl Wave shows Bitcoin investors are unwilling to sell. Source: Philip Swift
Crypto market data and blockchain analytics firm IntoTheBlock found a similar pattern. Its researchers said the number of large Bitcoin transactions has noticeably declined since May 19. The drop-off in large transactions indicates whales or big individual holders of BTC are not selling. The researchers explained:
“The number of Large Transactions greater than $100k for #Bitcoin started to decline consistently from 9.71k transactions on May 19 (moving 1.04m #BTC and $10.93b) to 8.94k transactions on May 26 (moving 798.54k $BTC and $7.07b).”
Additionally, Scott Melker, a cryptocurrency investor, emphasized that major hedge fund managers in the financial sector began to struggle as the pandemic caused a steep stock market pullback. Considering the high level of volatility in the financial market and in traditional assets such as oil, Bitcoin has recovered relatively well from its “Black Thursday” plunge to $3,600 on March 13. Melker noted:
“My best friend manages 2 billion at a hedge fund. He just told me they’ve been taking most of their money off of the table because the market makes no sense and ‘you can’t put that much capital to work with no conviction.’ Even the big boys have gotten slaughtered.”
The perception of Bitcoin as a store of value and a newly emerging hedge against inflation has improved as a result, causing a rise in inflow of capital into the Bitcoin market from institutional investors.
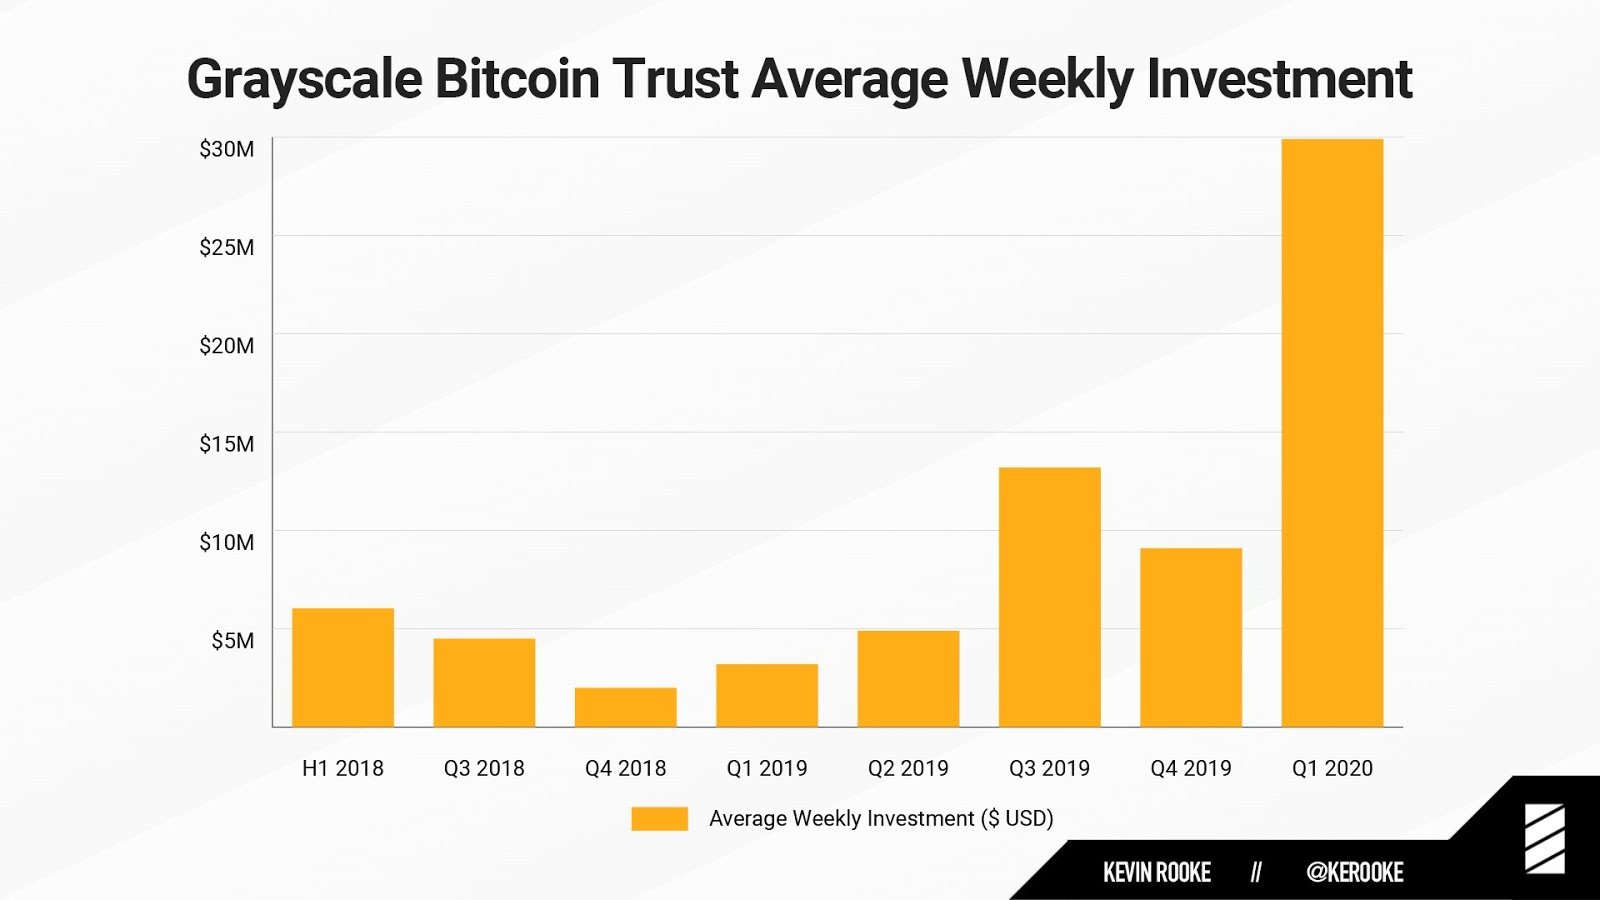
In the first quarter of 2019, the Grayscale Bitcoin Trust — an investment vehicle that allows institutions to buy into Bitcoin through the public market — recorded an average weekly investment of $3.2 million. In the first quarter of this year, the average weekly investment rose to $29.9 million, increasing by almost 10 times year over year.
Grayscale Bitcoin Trust average weekly investment since 2018. Source: Kevin Rooke
The rise in institutional activity in the Bitcoin market, the reluctance of many investors to sell at current prices, the drop in large transactions, and the tendency of BTC to see a short squeeze when a negative funding rate emerges all point toward a short-term price uptrend.
Bearish scenario in the short term
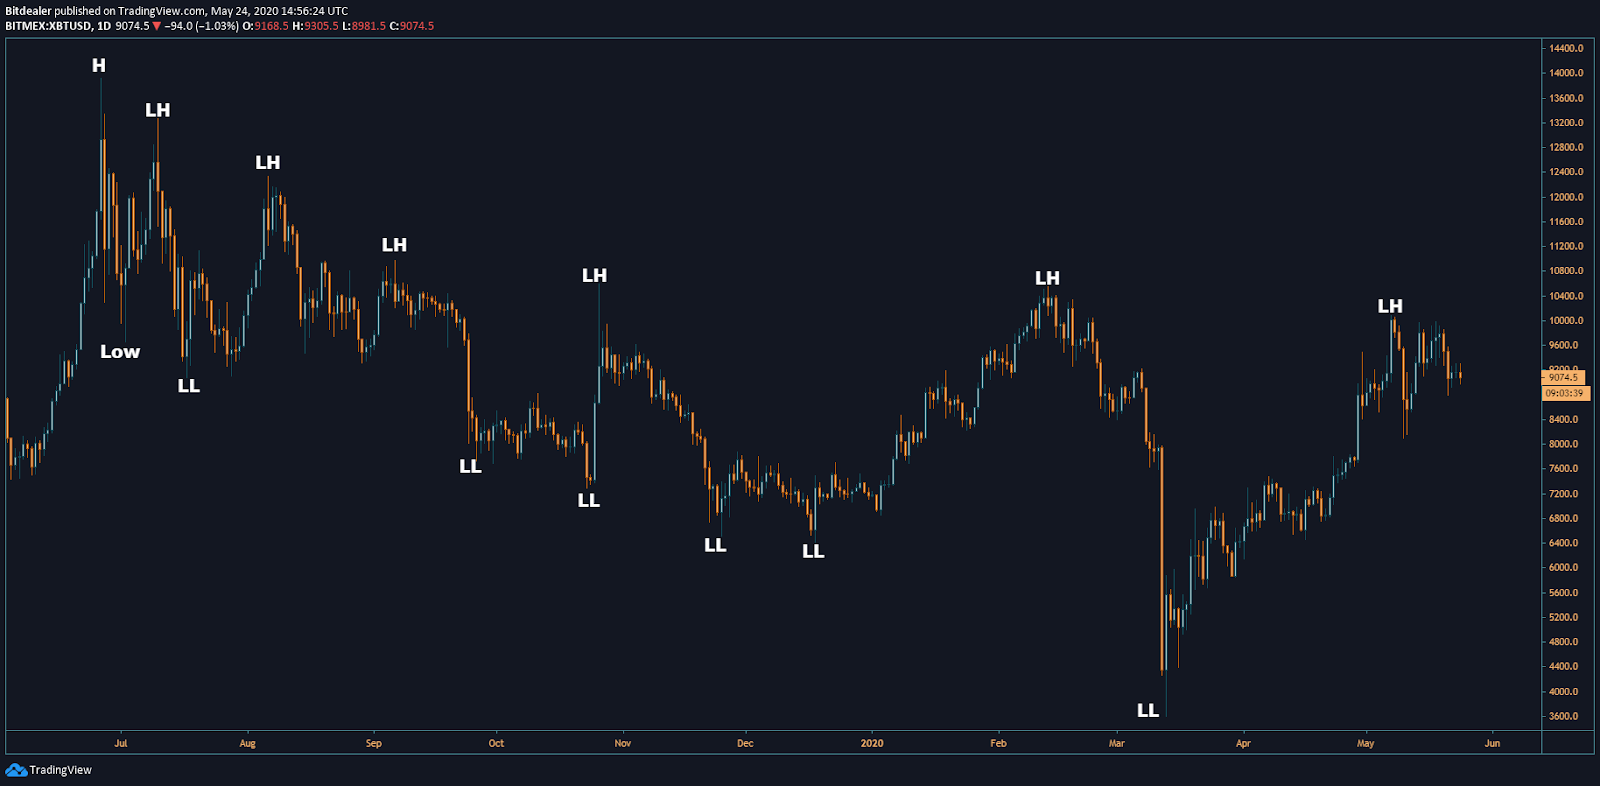
The bearish scenario for Bitcoin in the near term is a pullback to the $5,800–$7,100 range. Currently, Bitcoin is technically in a lower high formation dating back to June 2019. A “lower high” is formed when the latest peak is lower than the previous high point. As an example, Bitcoin rose to as high as $10,500 in February. This month, it topped out at $10,080, making it a lower high.
Bitcoin has seen six lower highs in a row in the past 12 months, which indicates a bearish cycle spanning over a long period of time. If BTC fails to break above $10,000, it increases the probability of the resumption of a correction. A cryptocurrency researcher at Market Science known as BitDealer said about the lower high formation:
“[Bitcoin] doesnt look too good. Really interesting to me how we haven’t taken out any of those highs considering how close price got to them. Reminds me how clean the LHs [lower highs] were following the 20k top. Until we get a HH [higher high], good idea to short near the highs/take profit on longs.”
Lower highs on Bitcoin daily chart since June 2019. Source: Bitdealer
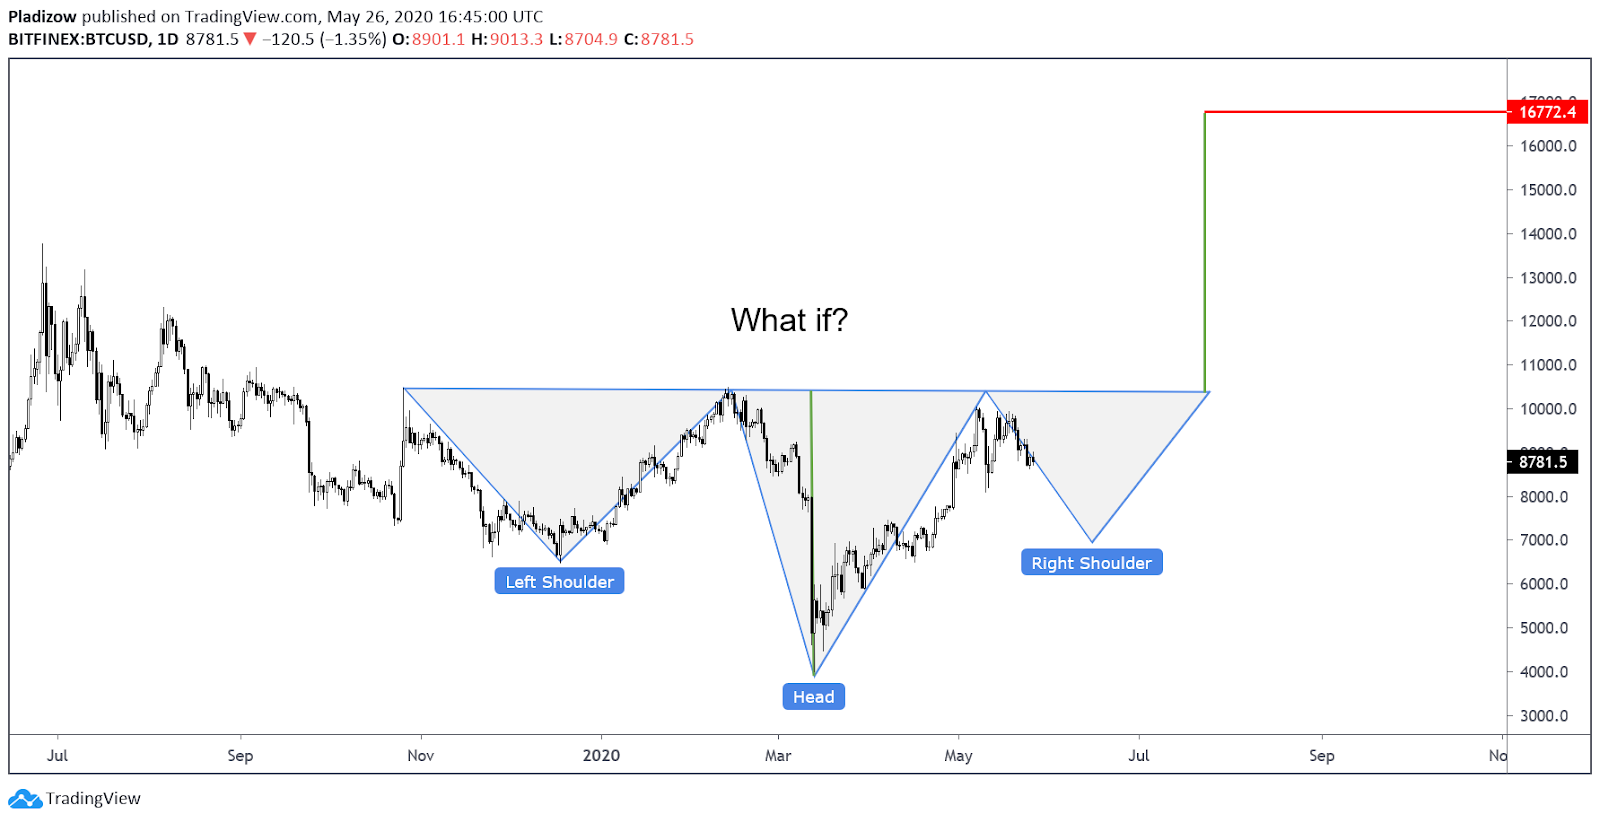
Most bearish theories put out by traders anticipate a short-term decline in price but a strong recovery over the medium to long term. Bitcoin trader Nunya Bizniz suggested BTC may be showing a rough inverse head and shoulders pattern, which is regarded as a textbook bottom indicator. For it to materialize, however, Bitcoin has to fall to at least $7,100, which goes in line with predictions by other prominent traders.
A possible inverse and head shoulders pattern forming. Source: Nunya Bizniz
The price of Bitcoin increased from $8,600 to $9,200 on May 27, but it pulled back almost immediately afterward. The $9,200 level was an important CME gap, which was formed when the CME futures market closed during the weekend. The closure of a CME gap could lead to a drop in the price of BTC, as it tends to hit the gap then reverse.
Variables that can affect the price
Bitcoin saw a price spike as Goldman Sachs conducted a client call on the topic of Bitcoin, gold and inflation. The talk of one of the biggest investment banks in the U.S. discussing the dominant cryptocurrency with its clients led to increased anticipation of further institutional adoption. But on the slide presented to clients, Goldman Sachs reaffirmed its neutral stance on Bitcoin. The slide titled “Cryptocurrencies Including Bitcoin Are Not an Asset Class” read:
“We also believe that while hedge funds may find trading cryptocurrencies appealing because of their high volatility, that allure does not constitute a viable investment rationale.”
Goldman Sachs simply said that Bitcoin does not show evidence of being a hedge against inflation and that the only appeal to institutions is its volatility. Barry Silbert, the CEO of Digital Currency Group and Grayscale, said: “Just reviewed the slides from the Goldman client call later this morning re gold & Bitcoin. This slide header summarizes Goldman’s take.”
The actual content of the presentation by Goldman Sachs about Bitcoin and gold does not describe Bitcoin in a way that would invite the bank’s clients to trade or invest in the asset. Hence, the narrative that it would lead more high-net-worth individuals and institutional clients to perceive Bitcoin as a hedge against inflation is false.
Other than that, there are several other minor variables such as miners selling more BTC than they mine on a daily basis post-halving and the increase in the open interest of the Bitcoin futures market that may fuel additional selling pressure.


