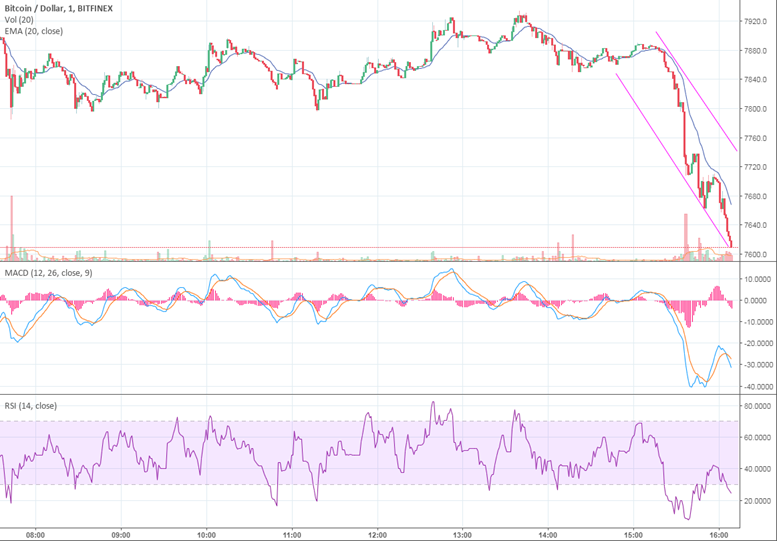
On Wednesday morning, Bitcoin price slid down below the critical $8,000 price point and is now sitting closer to $7,600. The previously established $8,100 support level was unable to hold. Over the past seven days, Bitcoin value plunged by nearly 8%.
BTC/USD On Long-Term Bearish Trend
Today’s freefall is a big indication that Bitcoin could be on a long-term bearish trend. As evidence; the six-month moving average has now moved in favor of the bears and forms a bearish crossover with the 10-month moving average. This kind of bearish crossover hasn’t happened since 2014.
Currently, BTC/USD must break above a major resistance level at $8,000 to gain any upward momentum. While its support is now set at $7,500, if the bearish trend continues, that level wouldn’t hold for long. On the down side, a movement towards $7,200 later this week might be possible.
Source: Tradingview
Both the MACD and RSI indicators are reaffirming this long-term bearish trend. Selling volume has also picked up, so Bitcoin is still under heavy selling pressure.
Looking at the Technical Indicators:
- Hourly MACD — Bearish signal
- Hourly RSI — Bitcoin is in a bearish zone
- Major Resistance Level — $8,000
- Major Support Level — $7,500
Featured Image: twitter


