

Bitcoin managed to stay above the $9,350 support area against the US Dollar. BTC price is currently recovering, but it must surpass $9,825 for a strong upward move.
- Bitcoin price is currently correcting higher from the $9,350 support area against the US Dollar.
- There is a strong resistance waiting on the upside near the $9,825 level.
- Recently, there was a break above a contracting triangle with resistance near $9,665 on the hourly chart of the BTC/USD pair (data feed from Kraken).
- The pair could either rally above $9,825 or it might start a fresh decline back to $9,350.
Bitcoin Approaching Key Resistance
After a close below the $9,500 level, bitcoin price extended its decline below $9,400 against the US Dollar. However, BTC remained stable above the $9,340 and $9,350 levels.
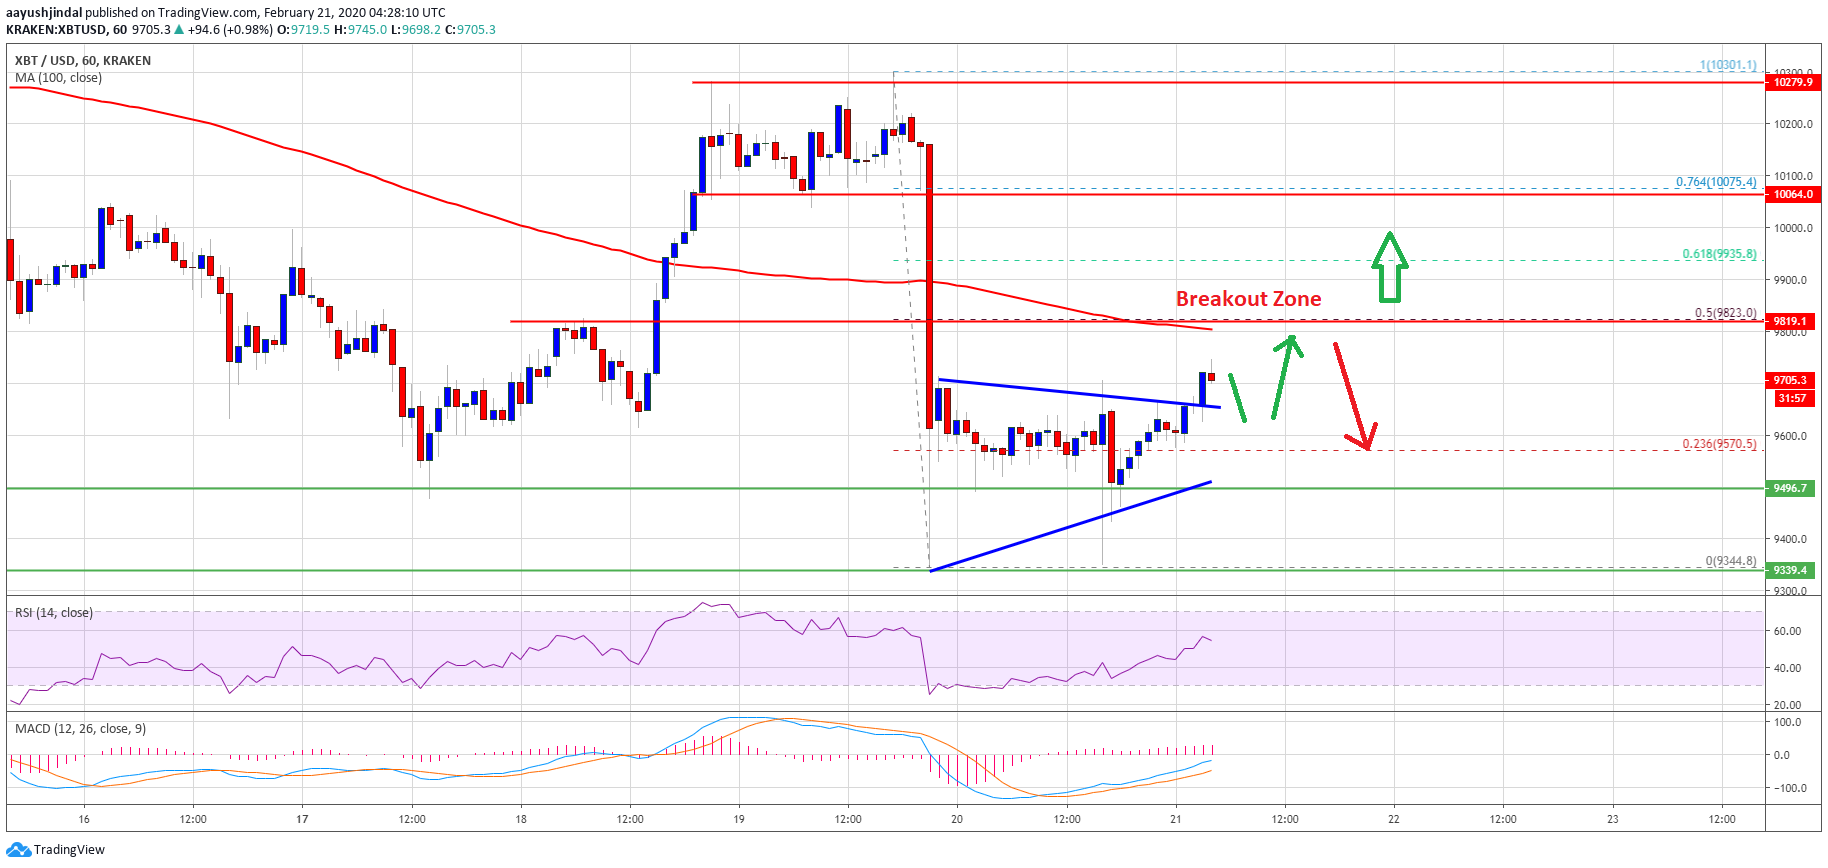
A swing low is formed near $9,344 and the price is currently recovering. It surpassed the 23.6% Fib retracement level of the recent slide from the $10,300 high to $9,344 low.
Moreover, there was a break above a contracting triangle with resistance near $9,665 on the hourly chart of the BTC/USD pair. The pair is now trading nicely above the $9,700 level, but there are many key hurdles waiting on the upside.
The first resistance for bitcoin is near the $9,825 level and the 100 hourly simple moving average. It is also close to the 50% Fib retracement level of the recent slide from the $10,300 high to $9,344 low.
Therefore, a clear break above the $9,825 resistance and the 100 hourly SMA could set the pace for a larger upward move in the near term. The next major resistance is near $10,060, above which the price is likely to aim a break above the $10,300 swing high. Any further gains could lead the price towards the $10,500 resistance.
Another Failure?
If BTC fails to continue above the $9,825 resistance and the 100 hourly SMA, there could be another decline. An initial support is near the $9,620 level.
The first key support is near the $9,500 level, below which bitcoin could revisit the $9,350 support area. If the bears are able to clear the $9,350 support, the next stop for them may perhaps be near the $9,050 level.
Technical indicators:
Hourly MACD – The MACD is slowly gaining strength in the bullish zone.
Hourly RSI (Relative Strength Index) – The RSI for BTC/USD is now above the 50 level, with positive signs.
Major Support Levels – $9,500 followed by $9,350.
Major Resistance Levels – $9,825, $10,000 and $10,060.


