Ethereum found support above $580 and corrected higher against the US Dollar. ETH price is facing a strong resistance near the $600 and $602 levels.
- Ethereum started a decent recovery wave above the $585 and $590 levels.
- The price is approaching the $600 barrier and it is above the 100 hourly simple moving average.
- There is a key contracting triangle forming with resistance near $600 on the hourly chart of ETH/USD (data feed via Kraken).
- The pair could gain bullish momentum if there is a clear close above the $600 and $602 levels.
Ethereum Price is Showing Positive Signs
After a downside reaction, Ethereum started a recovery wave above the $580 level. ETH price also remained stable the $585 level and the 100 hourly simple moving average.
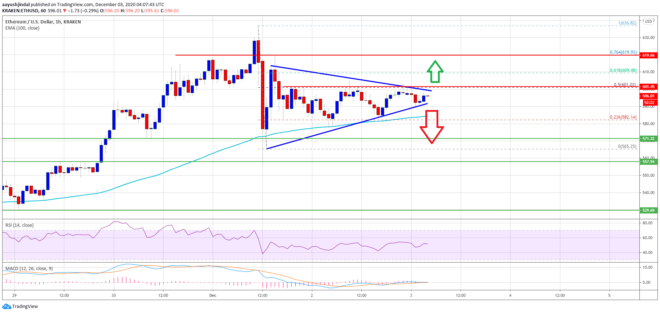
The price is currently stuck in a range below $600 (similar to bitcoin) and it seems to be preparing for the next move. The last swing low was formed near the $565 level before the price recovered above the 23.6% Fib retracement level of the key downward move from the $636 high to $565 low.
Ether is currently approaching the $600 barrier and it is above the 100 hourly simple moving average. There is also a key contracting triangle forming with resistance near $600 on the hourly chart of ETH/USD.

The triangle resistance coincides with the 50% Fib retracement level of the key downward move from the $636 high to $565 low. A successful close above the $600 and $602 resistance levels could open the doors for a sharp increase.
The next key resistance is at $610, above which the price may even clear $620. Any more gains will most likely call for a new yearly high above $636.
Downside Break in ETH?
If ethereum fails to clear the triangle resistance and $602, there is a risk of a fresh decline. An initial support is near the $590 level and the triangle lower trend line.
A downside break below the triangle support might push the price towards the $585 support and the 100 hourly simple moving average. Any more losses may possibly set the pace for a fresh decline towards the $565 swing low in the coming sessions. An intermediate support sits near the $570 level.
Technical Indicators
Hourly MACD – The MACD for ETH/USD is slowly gaining momentum in the bearish zone.
Hourly RSI – The RSI for ETH/USD is currently well below the 50 level.
Major Support Level – $570
Major Resistance Level – $600