Until the end of 2021, OpenSea sailed relatively unchallenged on the NFT seas. That changed in early 2022 with the launch of LooksRare in January 2022 and X2Y2 in February 2022. The new competitors brought different relationship dynamics with users and collections, and added new features and perks to increase transaction volume.
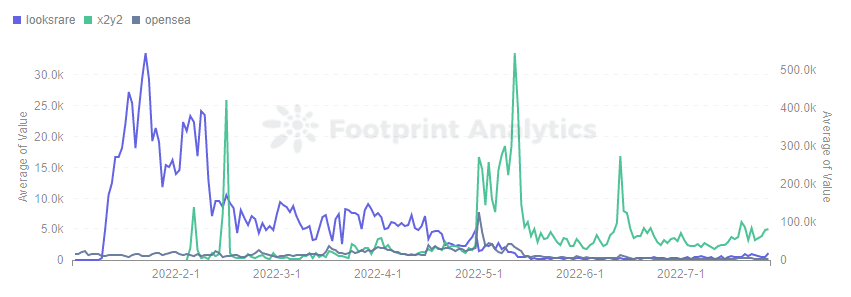
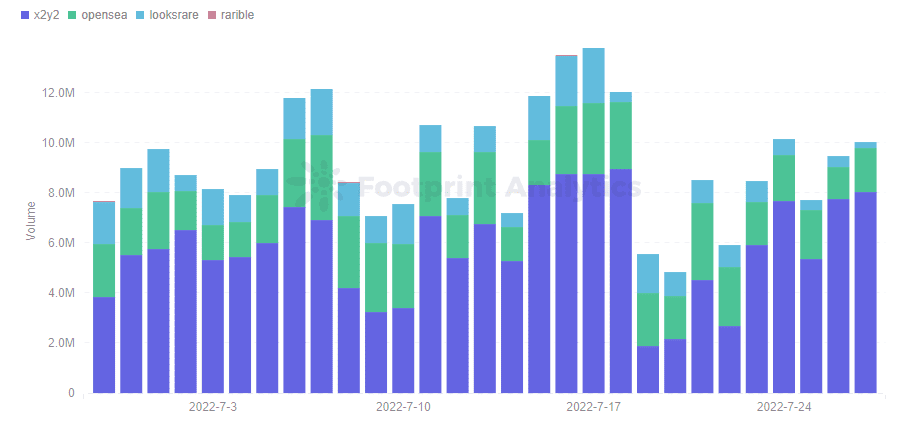
The chart below from Footprint Analytics shows the daily transaction volume in USD value for each protocol. As we can see, there has been a lot going on in the NFT marketplaces so far this year.
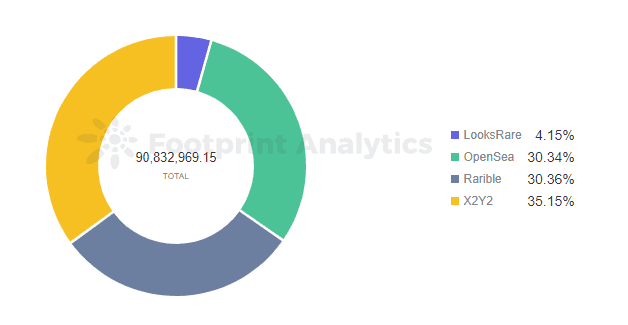
Footprint Analytics – Market Share of OpenSea & X2Y2 & LooksRare Volume
LooksRare got a larger and larger market share after its launch, but when X2Y2 debuted with better trading conditions and a different proposal for their native X2Y2 token, some of the LooksRare market share migrated to X2Y2. Since mid-May, X2Y2 has consistently had a larger market share of trading volume than OpenSea. X2Y2 now has over 50% of the trades recorded. This raises the question:
- Where is this volume coming from?
- What is being traded on these new marketplaces?
- What does this mean for the NFT market in general, and what should investors take away from it?
What the new players brought to the game
At launch, LooksRare and X2Y2 took the same approach to attracting users to OpenSea – namely, giving tokens to active users who switched from one platform to another. This strategy is known as the “vampire attack” and aims to gain a financial advantage with the token issued by the platform.
But these two new platforms weren’t a simple “copy and paste” of OpenSea. The table below shows what new features they introduced alongside the native token offering.
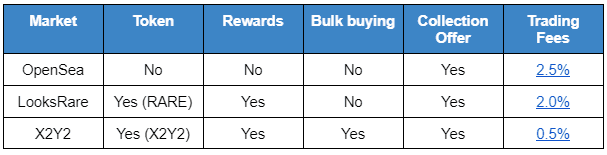
New features like bulk purchases (shopping carts) and lower fees charged by the platform help LooksRare and X2Y2 differentiate themselves in the market. The rewards also provide an additional revenue stream for token holders, as these tokens are also entitled to a portion of the revenue generated by the platform.
Trading: number of users, transactions and average trade size
Looking at the number of users over time, the new platforms were able to gain some traction at launch, but OpenSea’s dominance remained, as shown in the daily active users chart below. The daily user count is 8 times higher than the second provider, X2Y2.
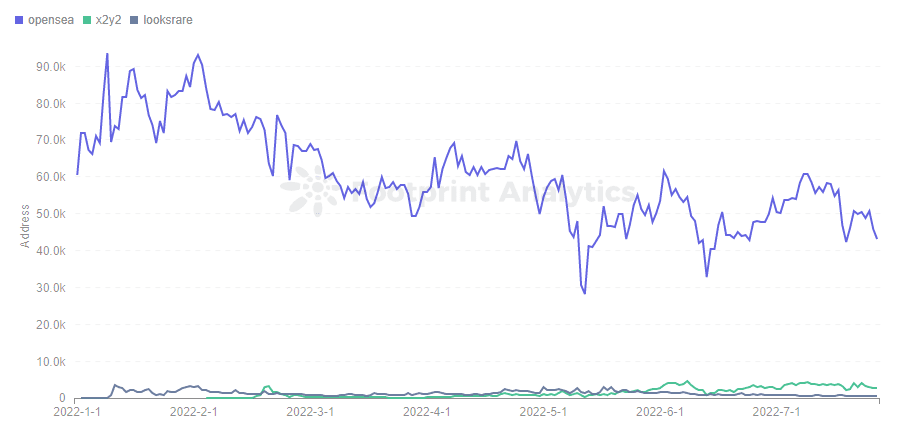
Footprint Analytics – OpenSea & Looksrare & X2Y2 Daily Active User
Since the number of transactions usually reflects the number of users, Opensea remains dominant in this metric as well. The Footprint Analytics chart below shows us similar numbers, with OpenSea averaging 8 times the transaction volume as the runner-up.
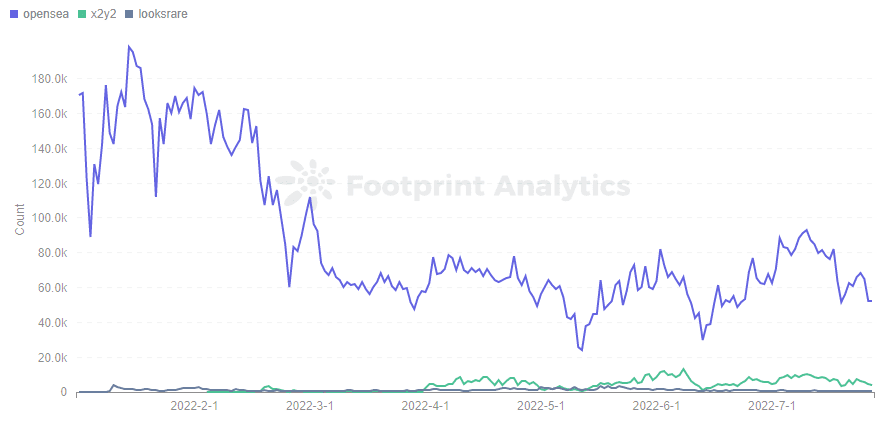
Footprint Analytics – Number of OpenSea & Looksrare & X2Y2 Transactions
It is clear that OpenSea has the largest number of transactions and users, while X2Y2 is a distant second. However, if we take a closer look at the average value of each transaction, the picture changes: LooksRare and X2Y2 have a higher average price.
Footprint Analytics – Average Daily Trading Volume of OpenSea & Looksrare & X2Y2
OpenSea has more trades, but the larger ones went to competitors. The average trade size on OpenSea has been $260 since May. The combination of high quality trades and a growing user base allowed X2Y2 to become the number one marketplace in terms of USD volume, as seen in the chart at the beginning of this article.
Where the top NFT collections are traded
The following charts, provided on the Footprint Analytics Dashboard, show some of the “blue chip” collections that consistently have the largest trading volume. These charts allow us to review how transactions are distributed between OpenSea, Looks Rare, X2Y2, and other marketplaces.
Meebits transaction distribution, last 30 days – source: Footprint Analytics
BAYC transaction distribution, last 30 days – source: Footprint Analytics
MAYC transaction distribution, last 30 days – source: Footprint Analytics
Otherdeed transaction distribution, last 30 days – source: Footprint Analytics
Based on the information gathered in the previous sections, we have confirmation that some of the most important NFT collections are traded at X2Y2 when possible, for which there are several explanations:
- The lower fees charged by the marketplace make it more profitable for sellers to use X2Y2, especially when dealing with higher value items.
- The shopping cart (wholesale) feature. This simplifies the buying process by allowing the buyer to select everything and then proceed to checkout. By making multiple purchases in one transaction, gasoline costs can also be saved.
- The rewards in X2Y2 native tokens distributed to buyers and sellers, and the fee revenue share create a virtuous growth cycle.
There is a high likelihood that these terms will lead to higher adoption by retailers (who deal in lower value items), making the X2Y2 native token a good investment opportunity to enter the NFT market without buying a specific collection.
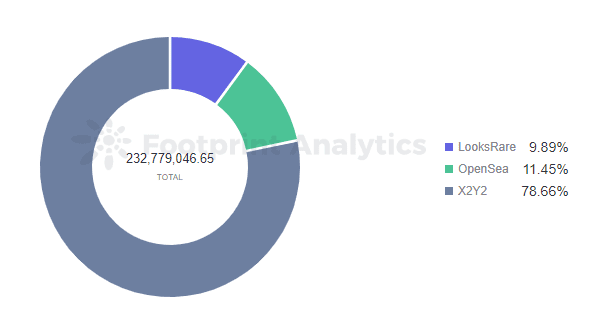
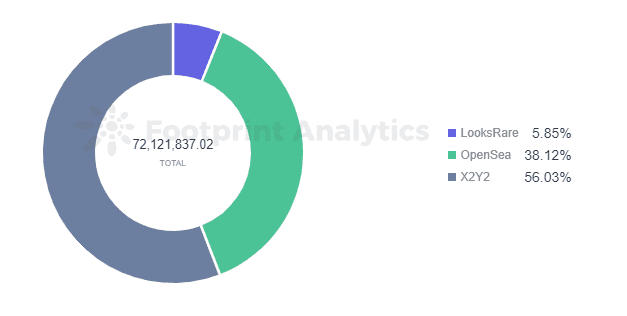
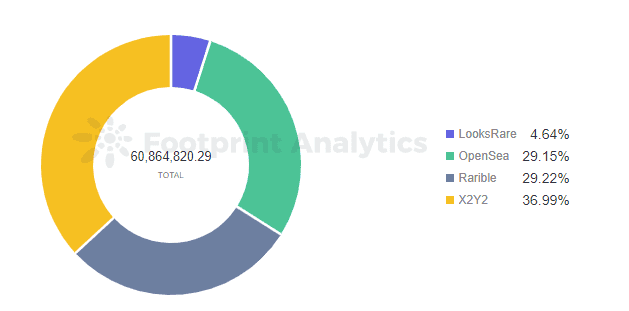
Footprint Analytics – Volume of BAYC/MAYC/Meebits/Otherdeed in Different Marketplace(Last 30 Days)
Key findings for investors (TL;DR):
After combining the information presented in the charts, a clear picture emerges: X2Y2 is the leading market for blue-chip NFT collections, with consistently high USD transaction volumes. Smart NFT traders have already figured out that a lower fee saves a lot of money. Therefore, the lower cost market (X2Y2) is preferred when possible.
Since X2Y2 shares the trading fee revenue with X2Y2 token holders, a sound investment strategy is to buy their native token to get involved in the NFT market.


