Bitcoin price may rise to a new 52-week high if it can break above the ascending channel and this move could ignite the altcoins.
Crypto market sentiment appears to be improving across the board and the global push to mainstream central bank digital currencies is also making headway.
In China’s Shenzhen province about 2 million people had applied for the digital yuan giveaway and the lucky 50,000 among them received “red envelopes” of digital yuan totalling $1.5 million.
By the end of Oct. 18 about 47,573 of the recipients had spent roughly $1.3 million of the bounty, amounting to 88% of the total giveaway. This suggests that the pilot program was a success and shows that China is far ahead of other developed economies in developing their central bank digital currency..
To speed up the process of launching its CBDC, the Bank of Canada recently listed a job opening for an economist with thorough knowledge of financial technology and digital currencies.
However, U.S. Federal Reserve Chair Jerome Powell seems unfazed by the progress other countries are making with CBDCs. According to Powell, “it’s more important for the United States to get it right than it is to be first.”
In other news, a survey by Statista shows that only 7% of Americans have used or owned Bitcoin (BTC).
This figure is far less than Nigeria where the penetration rate is 32%, but also higher than Germany and Japan. This shows that the asset class has a long way to go before it can truly become a ‘mainstream’ currency.
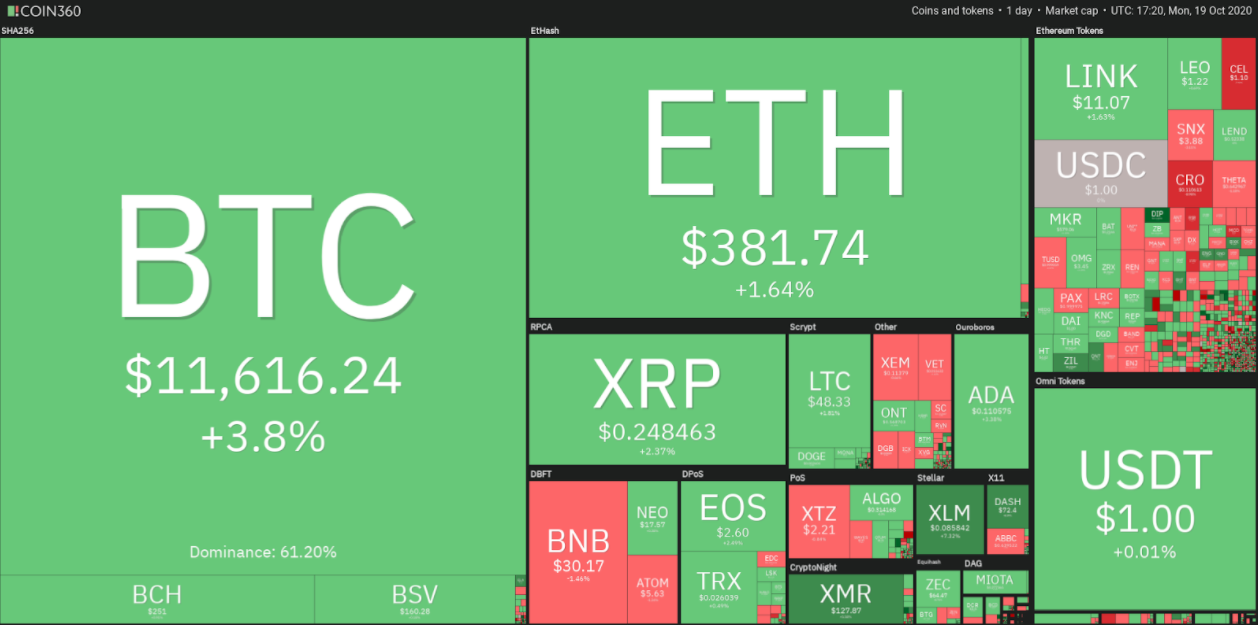
Currently, the bearish sentiment that dominated the markets for the past month appears to be alleviating as Bitcoin price moves closer the the $12K level.
Let’s study the charts of the top-10 cryptocurrencies to spot the ones that may perform well in the short-term.
BTC/USD
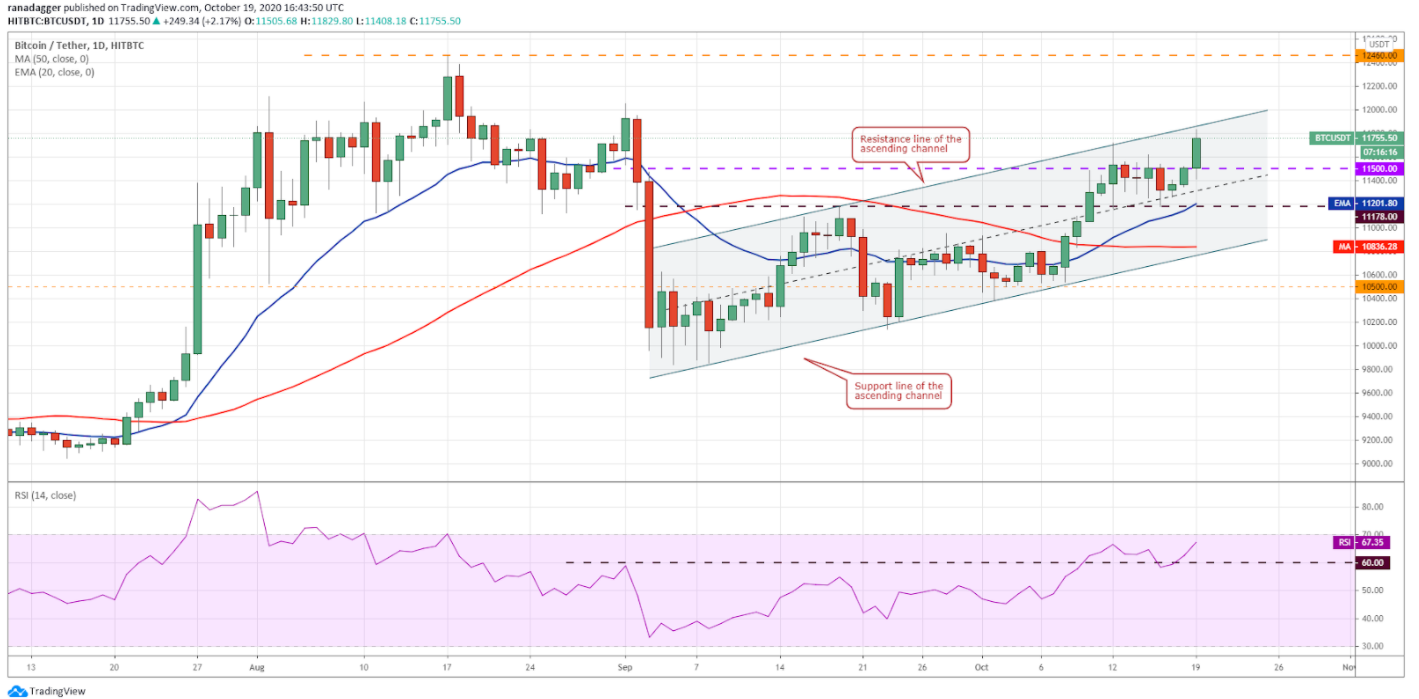
Bitcoin (BTC) has risen to the resistance line of the ascending channel where it could face selling pressure from the bears. However, the upsloping 20-day exponential moving average ($11,201) and the relative strength index above 67 suggests that bulls are in command.
If the bulls can exploit this advantage and push the price above the channel, the up-move could pick up momentum and quickly rally to $12,048.05. A breakout of this level may challenge the yearly highs at $12,460.
However, the bears are unlikely to give up without a fight. They will try to stall the rally at the resistance line. If the price turns down from the current levels but stays above $11,500, then the BTC/USD pair could slowly grind higher inside the channel.
The first sign of weakness will be a break below $11,178, and the trend will turn in favor of the bears if they can sink the price below the support line of the channel.
ETH/USD
The bears could not sustain Ether (ETH) below the moving averages on Oct. 16 and 17. This attracted buying and the bulls will now try to push the price above the overhead resistance at $395.
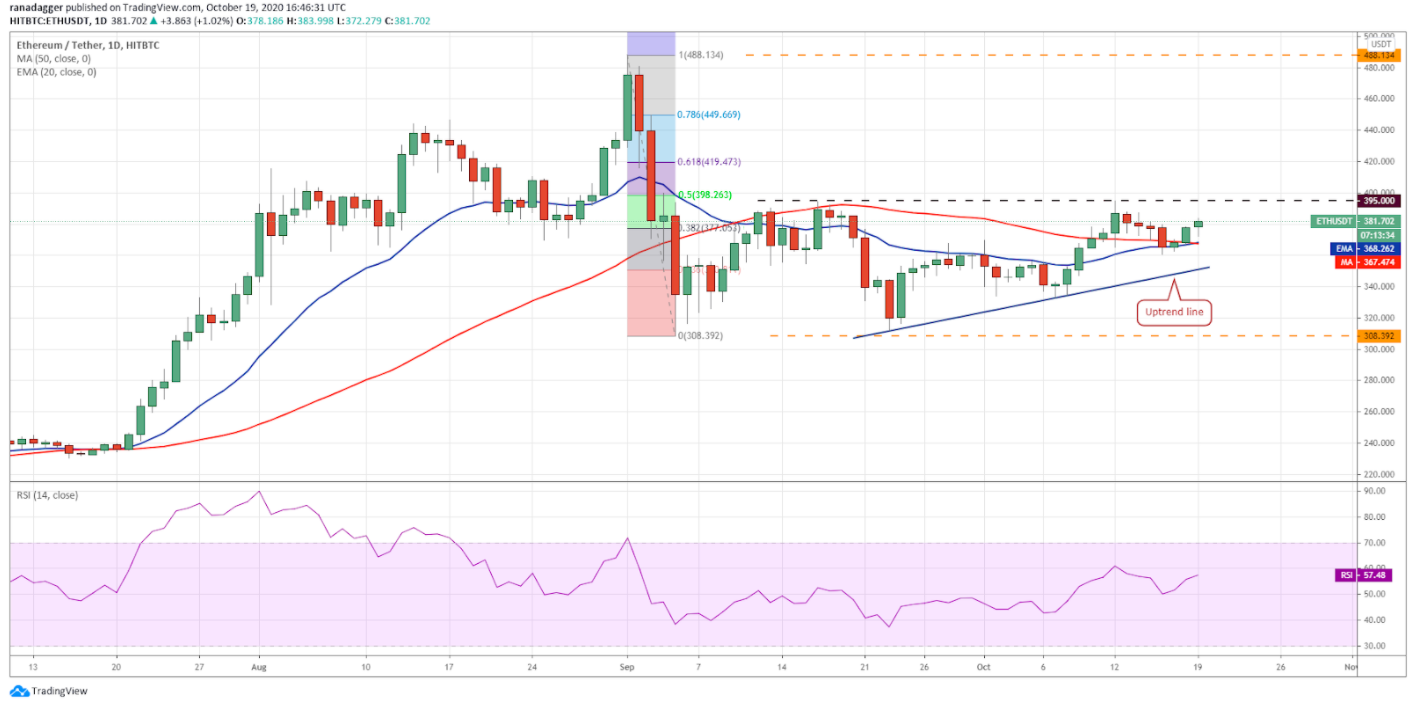
The 20-day EMA ($368) has started to turn up slowly, and the RSI has risen above 57, which suggests that bulls are attempting a comeback.
If the bulls can push and close (UTC time) the price above $395, it will complete an ascending triangle pattern. This bullish setup has a target objective of $478, just below the 52-week highs at $488.134.
This positive view will be invalidated if the pair turns down from the current levels or from $395 and plunges below the uptrend line. Such a move could keep the pair range-bound between $308.392 and $395 for a few more days.
XRP/USD
Although XRP broke below the moving averages on Oct. 15, the bears could not capitalize on this advantage and sink the price to the bottom of the range at $0.2295. This suggests a lack of sellers at lower levels.
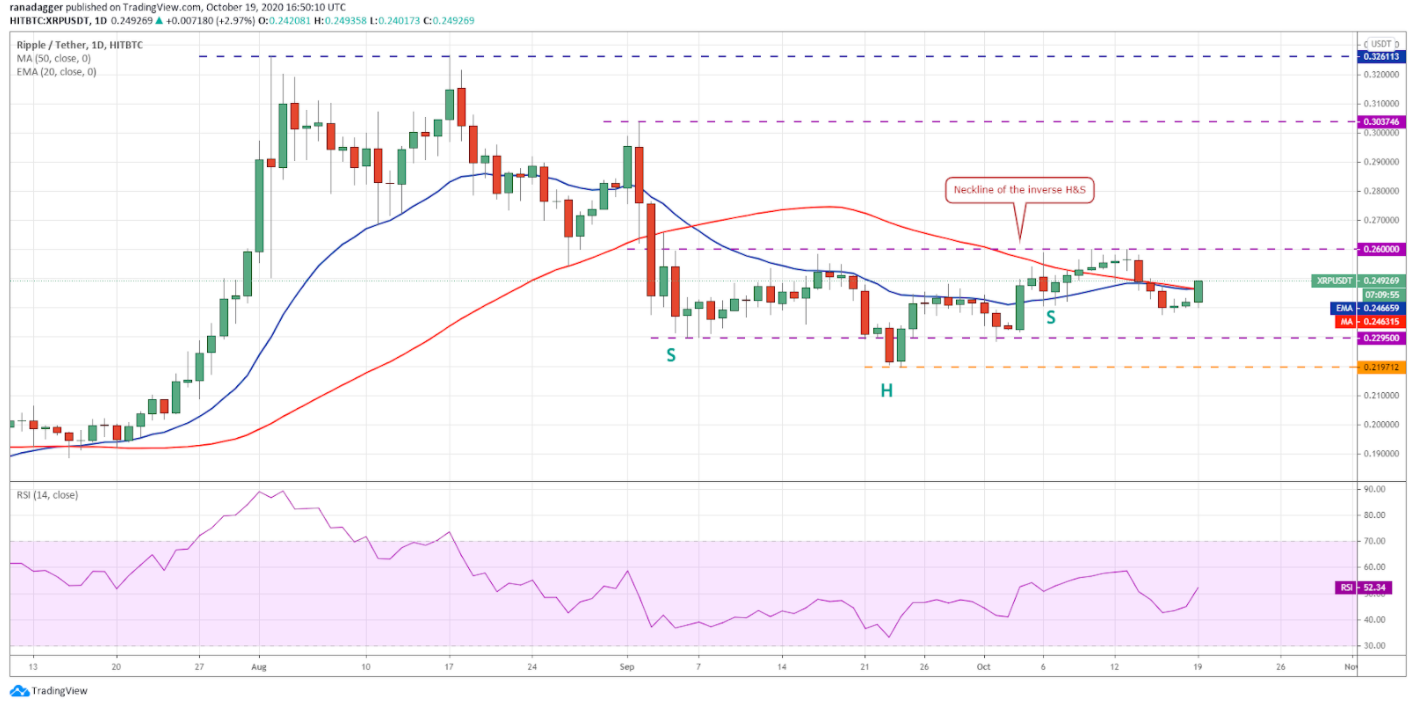
The bulls have currently propelled the price back above the moving averages. If they can sustain the higher levels, there will be another attempt to clear the $0.26 hurdle.
A breakout and close (UTC time) above $0.26 is likely to start a new uptrend that may reach $0.2905 and then $0.303746.
However, the flat moving averages and the RSI just above the midpoint suggest a balance between supply and demand. If the XRP/USD pair turns down from the current levels or $0.26, the range-bound action could continue for a few more days.
BCH/USD
The bulls have held the critical support at $242 for the past two days, and Bitcoin Cash (BCH) is now attempting to resume its up-move.
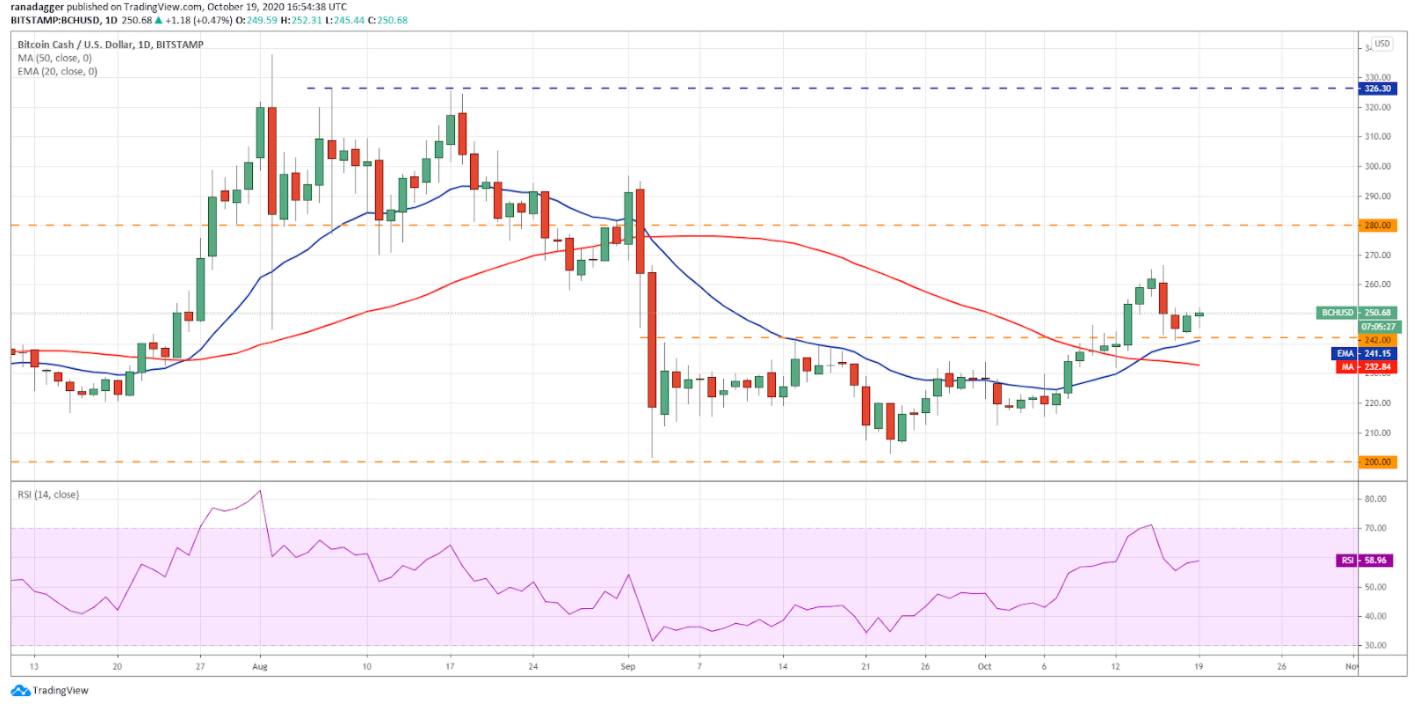
The upsloping 20-day EMA ($241) and the RSI above 58 indicates that the bulls are in control. The first target on the upside is $266.46, and if that is scaled, the up-move can reach $280.
However, if the bulls fail to push the price above $266.46, the BCH/USD pair could remain range-bound for a few days. A break and close (UTC time) below the moving averages will indicate weakness and could pull the price down to $200.
BNB/USD
The support at $29.5646 is acting as a new floor for Binance Coin (BNB). Both moving averages continue to rise, and the RSI has been sustaining in the positive zone for the past few days, which suggests that bulls are in command.
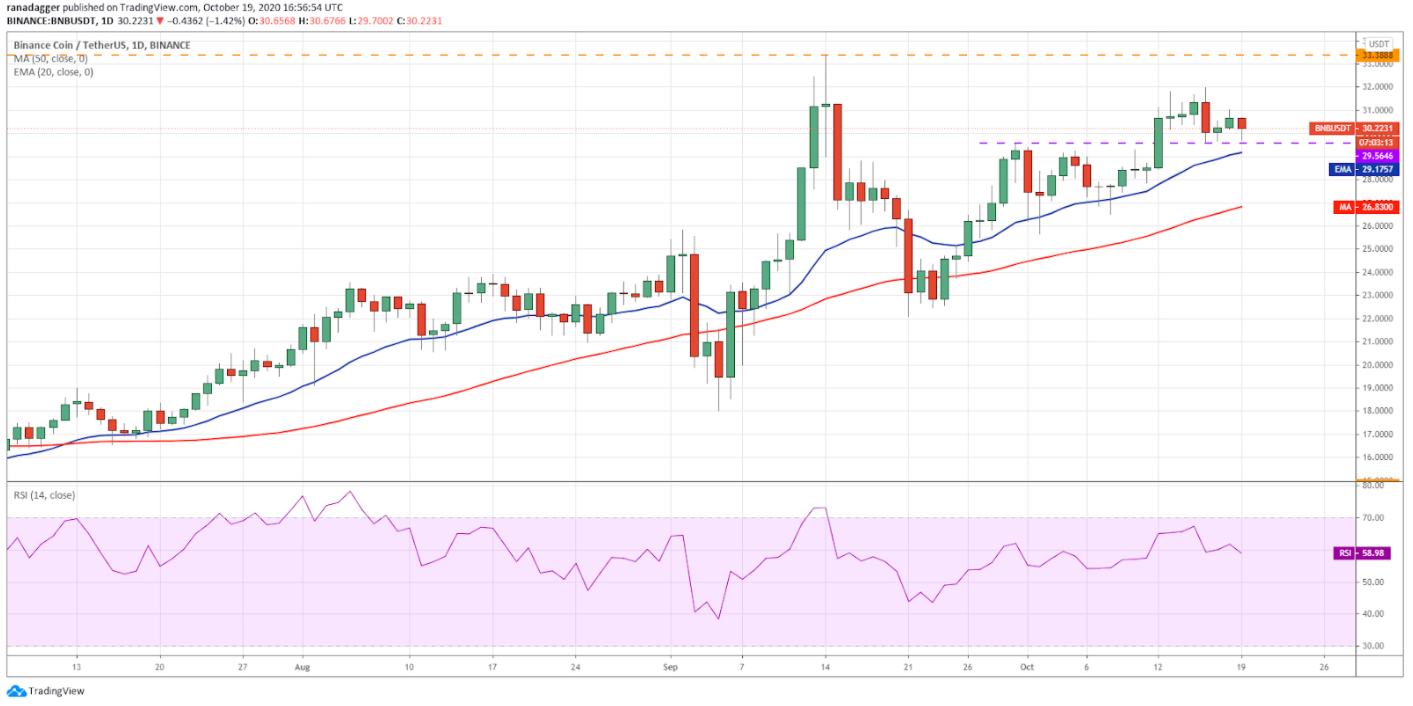
The bulls will now again try to push the price above the $32– $33.3888 resistance zone. If they can pull it off, the pair is likely to pick up momentum and challenge the all-time highs at $39.5941.
This bullish view will be negated if the BNB/USD pair turns down from the current levels or from the overhead resistance and sustains below the 20-day EMA ($29.17). Such a move could drag the price down to the 50-day simple moving average ($26.83).
LINK/USD
Chainlink (LINK) has held above the 20-day EMA ($10.52) for the past three days but the bulls have not been able to push the price back above the $11.1990–$11.8028 resistance. This suggests that demand is drying up at higher levels.
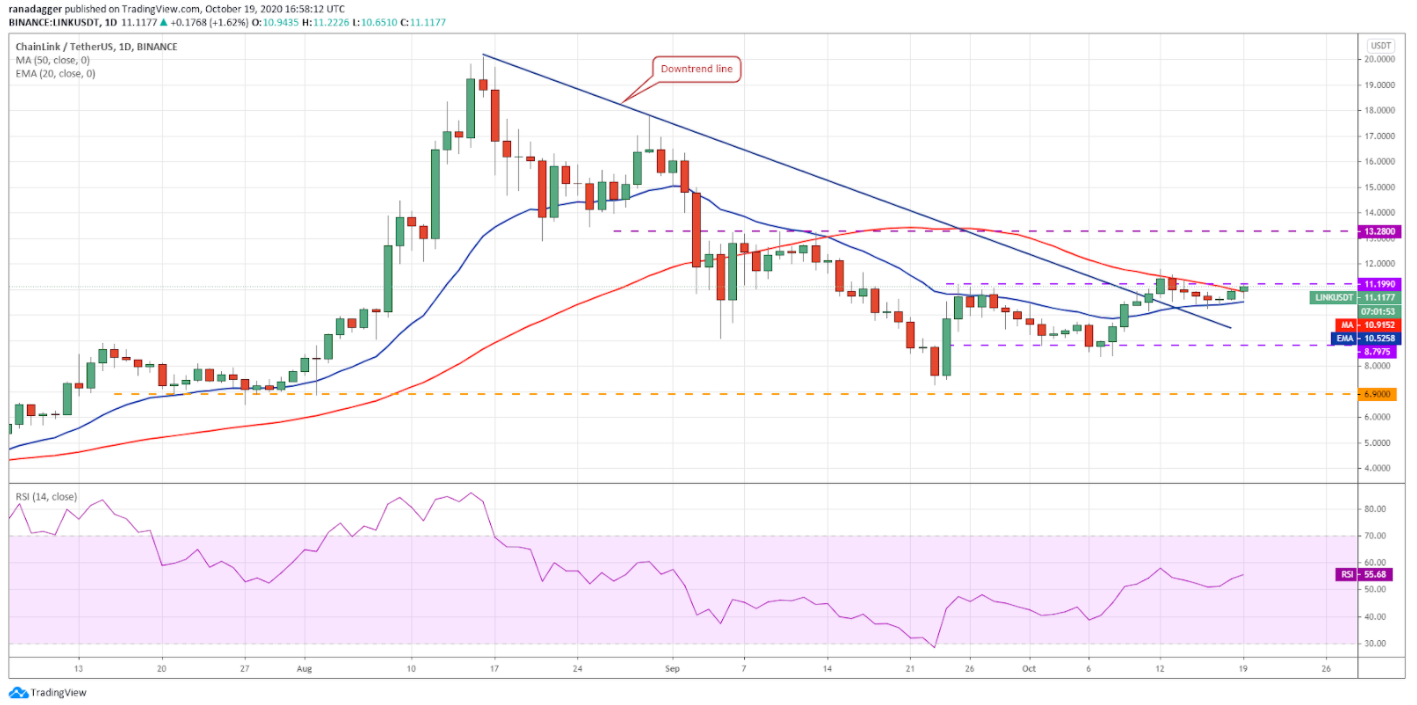
However, the gradually upsloping 20-day EMA and the RSI in the positive territory suggests a minor advantage to the bulls. The momentum could pick up after the bulls push the price above the overhead resistance zone. The first target is $13.28 and then $18.
This bullish view will be invalidated if the LINK/USD pair turns down from the current levels or the overhead resistance and breaks below $10.15. Such a move could pull the price down to the $8.7975 support.
DOT/USD
The failure of the bears to sink Polkadot (DOT) to $3.5321 suggests that lower levels are attracting buying by the bulls. If the buyers can push the price above the downtrend line, the bearish descending triangle setup will be invalidated.
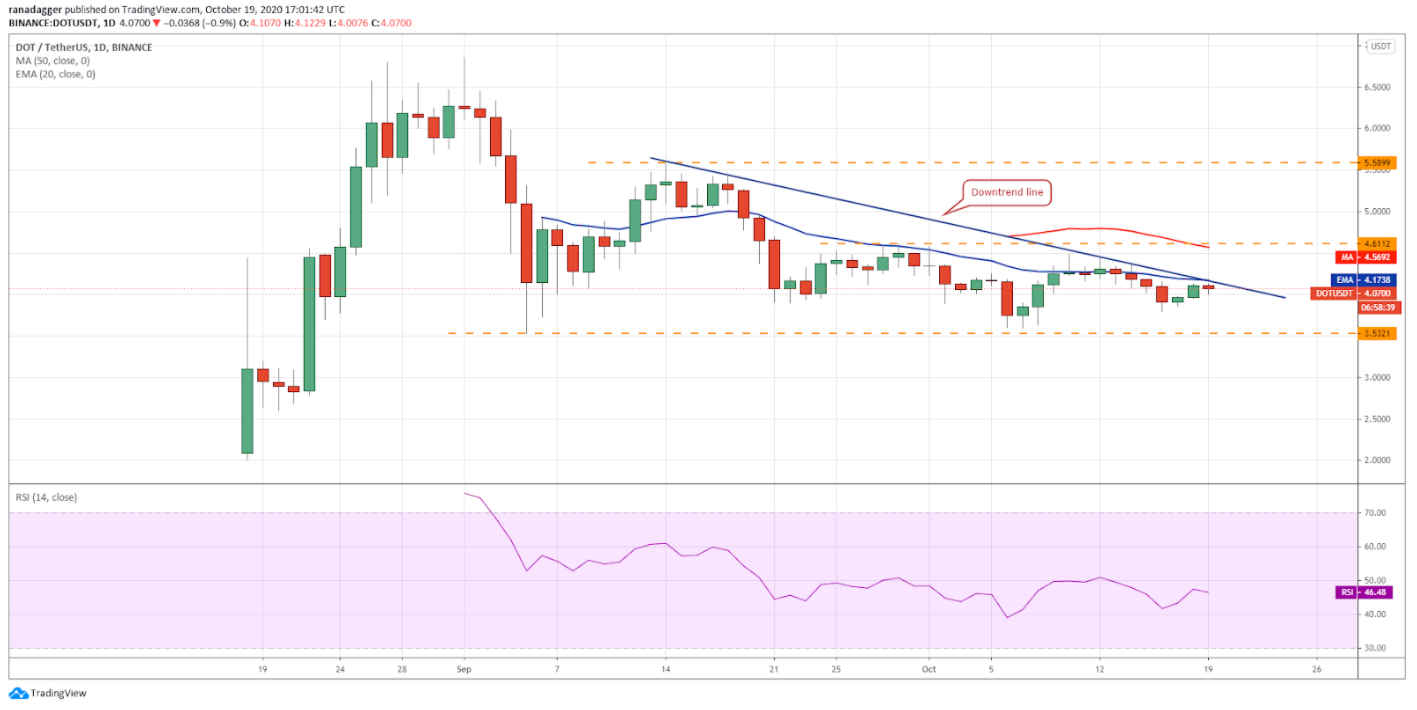
Above the downtrend line, the DOT/USD pair could move up to $4.6112 and if this level is crossed, the rally may extend to $5.5899.
However, the bears are unlikely to give up without a fight. The sellers will try to reverse the direction from the current levels and again at $4.6112. If the pair turns down from either resistance, it could again drop to $3.5321.
A breakdown and close (UTC time) below $3.5321 will signal that bears are back in command.
ADA/USD
Cardano (ADA) has bounced off the 20-day EMA ($0.103), which shows that the sentiment is positive and the bulls are accumulating at lower levels. The buyers will once again try to push the price above the resistance line of the rising wedge pattern.
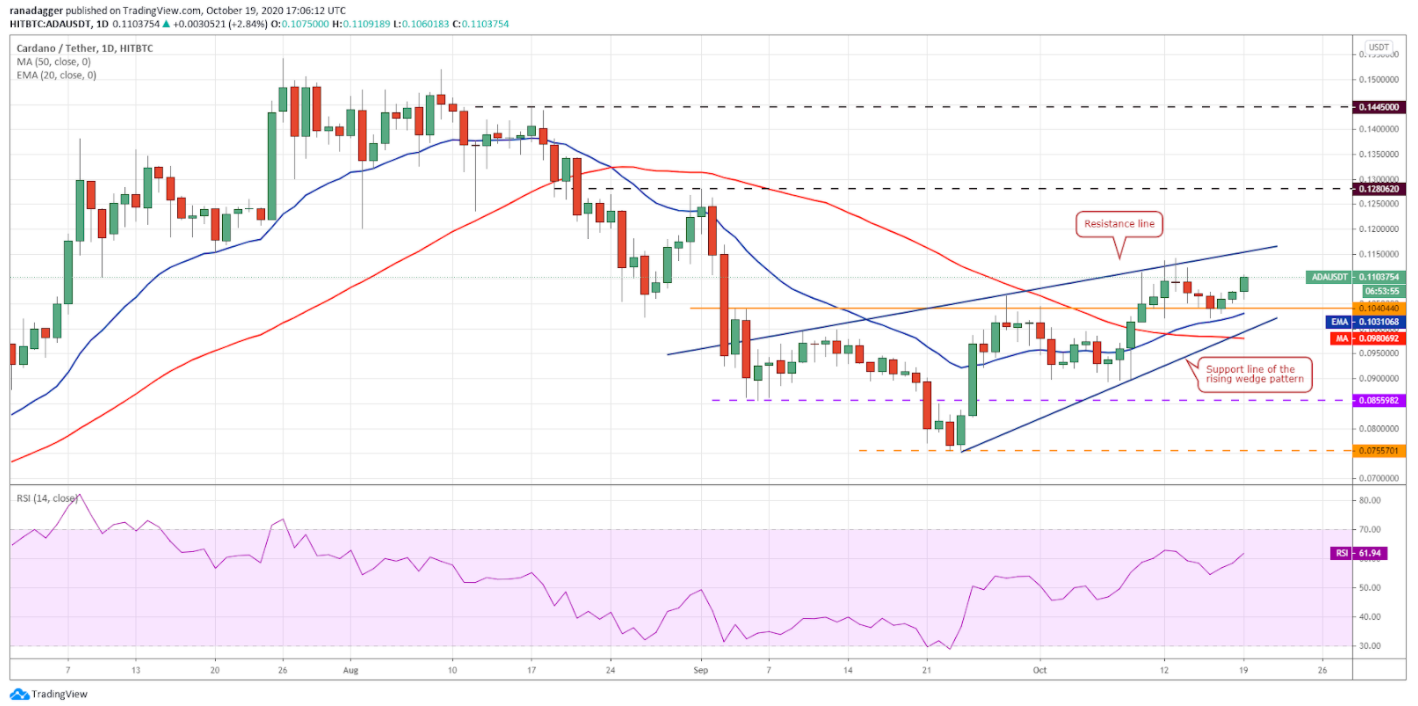
If the bulls can manage a close (UTC time) above the resistance line, a rally to $0.128062 and then to $0.1445 is possible. The upsloping 20-day EMA and the RSI above 61 suggest that the path of least resistance is to the upside.
Contrary to this assumption, if the ADA/USD pair turns down from the resistance line, the bears will once again try to sink the price below the 20-day EMA and the support line of the wedge. If they can do that, the advantage will tilt in favor of the bears.
LTC/USD
Litecoin (LTC) has bounced off the uptrend line and the bulls will now try to push the price above the moving averages. If the buyers can sustain the price above the moving averages, a move to the overhead resistance zone of $51–$52.36 is possible.
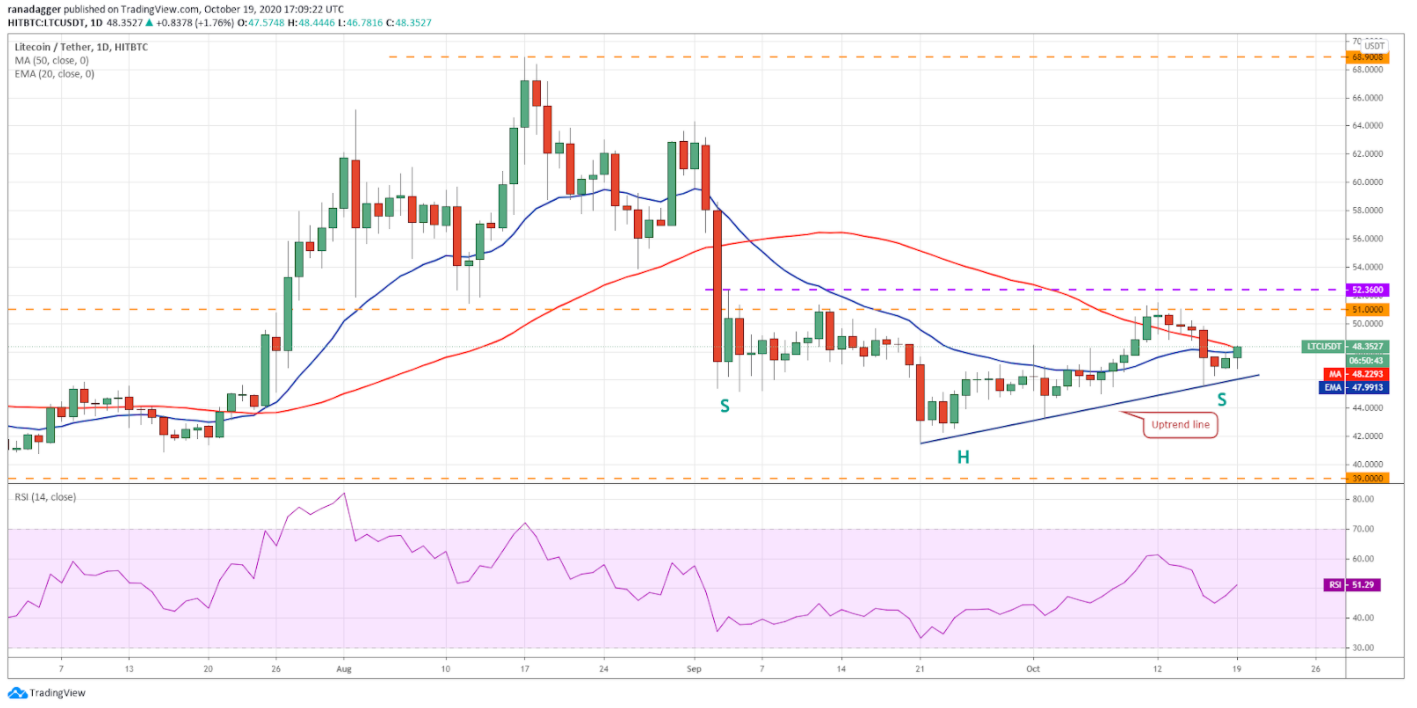
However, the bulls are unlikely to have it easy as the bears will try to defend the moving averages. If the LTC/USD pair turns down and breaks below the uptrend line, a drop to $42 will be on the cards.
Currently, the flat 20-day EMA ($47.99) and the RSI at the midpoint suggests a balance between supply and demand. Hence, the price action could remain volatile for the next few days as both the bulls and the bears try to dominate proceedings.
A breakout and close (UTC time) above the resistance zone will complete an inverse head and shoulders pattern that may signal the start of a new uptrend.
BSV/USD
Bitcoin SV (BSV) is attempting to stage a recovery but the rebound off the Oct. 16 intraday lows lacks strength. This suggests that the bulls are in no hurry to buy as they are not confident that the bottom is in place.
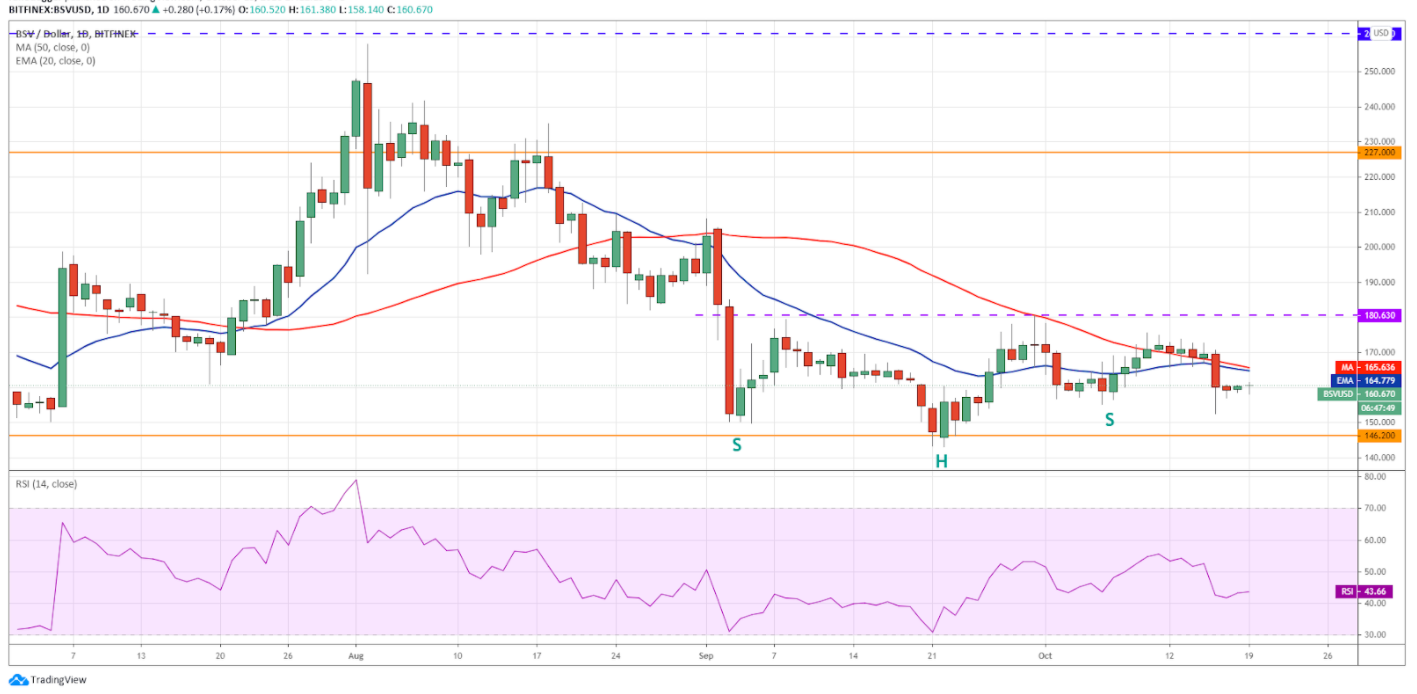
The downsloping moving averages and the RSI in the negative zone suggest that the advantage is with the bears. If the bulls do not push the price above the moving averages within the next few days, the bears will make one more attempt to sink the price to $146.20.
Conversely, if the bulls can push the price above the moving averages, the BSV/USD pair could move up to $180.63. A breakout and close (UTC time) above this resistance could start a journey to $189 and then to $227.
The views and opinions expressed here are solely those of the author and do not necessarily reflect the views of Cointelegraph. Every investment and trading move involves risk. You should conduct your own research when making a decision.
Market data is provided by HitBTC exchange.


