Bitcoin price has rallied more than $300 intraday, meanwhile, the S&P 500 has fallen almost ten basis points in the same time period. Is this the fabled stock market crypto “decoupling” that analysts claimed was coming, or is this just an anomaly before a return to the ongoing correlation between the vastly two different markets this year?
Bitcoin Blasts Higher While The S&P 500 Stumbles Lower, What Gives?
The leading cryptocurrency by market cap has had an explosive day. The cryptocurrency began the day bullish late last night after Sunday night’s weekly close.
The relatively neutral finish closed as green as bulls pushed Bitcoin price up higher over the weekend from late Friday lows. As the Monday morning weekday trading sessions began, however, Bitcoin began to really soar.
In a flash, Bitcoin reclaimed $11,500 and made another $300 push higher, topping out thus far at just over $11,800. Continuation above and beyond this point would take Bitcoin price back to the $12,000 range.
Related Reading | How Three Crypto Unicorns Going Public In 2021 Could Boost Bitcoin
What’s also notable about Bitcoin’s intraday performance, is that it is taking place all while the stock market sees a considerable setback.
The coming election and the potential end of a secular bull market hang in the balance of the remainder of the year. 2020 has already been one for the record books, both in terms of the challenges, the year has presented, but also in terms of how tightly the stock market and crypto have been correlated.
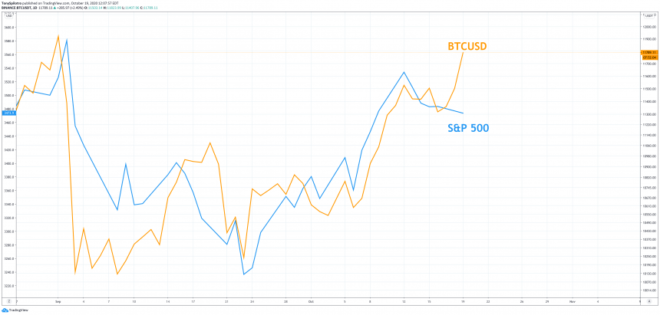
This correlation, however, appears to have ended as you can see in the chart below.
S&P 500 Versus Bitcoin 2020 Correlation Chart | Source: BTCUSD on TradingView.com
Crypto And Stock Market Decoupling Afoot? Or Is This Yet Another Correlation Anomaly?
Bitcoin’s latest pump has pushed prices higher, while stocks have fallen, has analysts who called for a decoupling handing out high-fives and cheering about their victory.
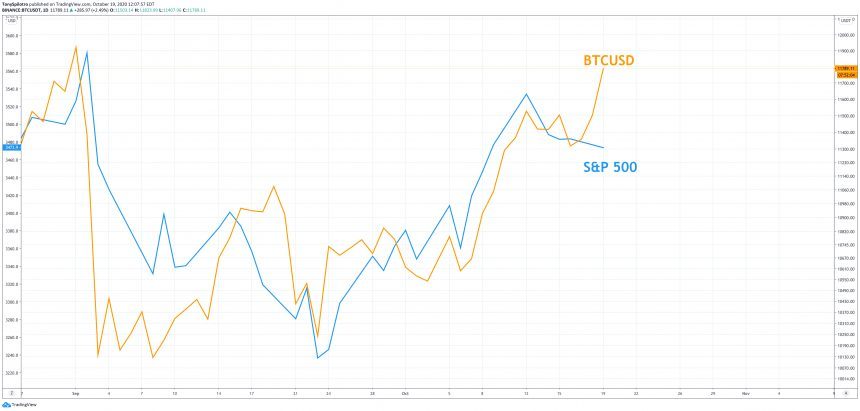
But it may be too soon for celebrating, as this isn’t the first time the correlation deviated briefly. In the zoomed-out chart below, there’s no denying how tight the correlation has been throughout the year so far.
S&P 500 Versus Bitcoin 2020 Correlation Chart | Source: SPX on TradingView.com
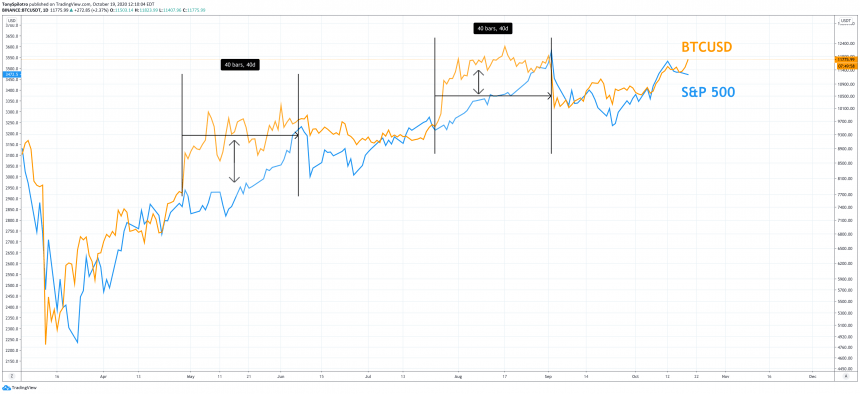
However, just as clear, are two divergences between the two asset’s price action. Both times, had Bitcoin climbing higher for roughly forty days before stocks followed suit.
Could the current divergence be nothing more than another anomaly in what has otherwise been a nearly exact correlation, or is this the decoupling underway?
Related Reading | Trader Warns: “Be Scared” Going To Bed Without Spot Bitcoin Exposure
Analysts behind the theory believe that Bitcoin fundamentals and network growth will soon send prices higher, regardless of what the stock market or S&P 500 is doing.
Featured image from Deposit Photos, Charts from TradingView.com