As Bitcoin rallies past $57k, Quant explains using on-chain analysis why the cryptocurrency may see a pullback here.
Bitcoin Funding Rate And Futures Open Interest Show Rising Values
As explained by an analyst in a CryptoQuant post, some BTC indicators are showing values that have historically signaled that a correction could be coming soon.
The first metric of relevance is the Bitcoin funding rate, which is defined as the periodic payment that futures contract traders have to pay. Positive values imply most traders are bullish and long traders are paying this fee to short traders.
While negative values mean just the opposite; traders are bearish on Bitcoin and short traders have to pay long traders.
The other indicator is the futures open interest. This metric shows the total number of futures contracts that are open at the end of the trading day.
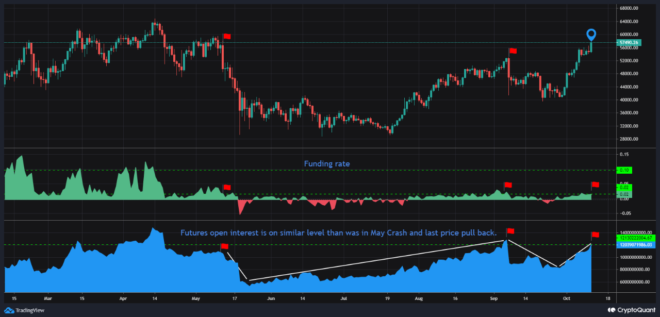
Here is a chart showing the trend in both these indictors for Bitcoin:
The funding rate and futures open interest vs the BTC price | Source: CryptoQuant
As the above graph shows, both the indicators have been observing a rise in their values recently. The quant has marked instances where similar values were seen on the chart before.
Looks like when such a trend in these metrics has been seen before, a correction has followed soon after.
Related Reading | Bitcoin Eclipses Trillion-Dollar Market Cap on Equity ETF Approval – Crypto Weekly Roundup, October 11, 2021
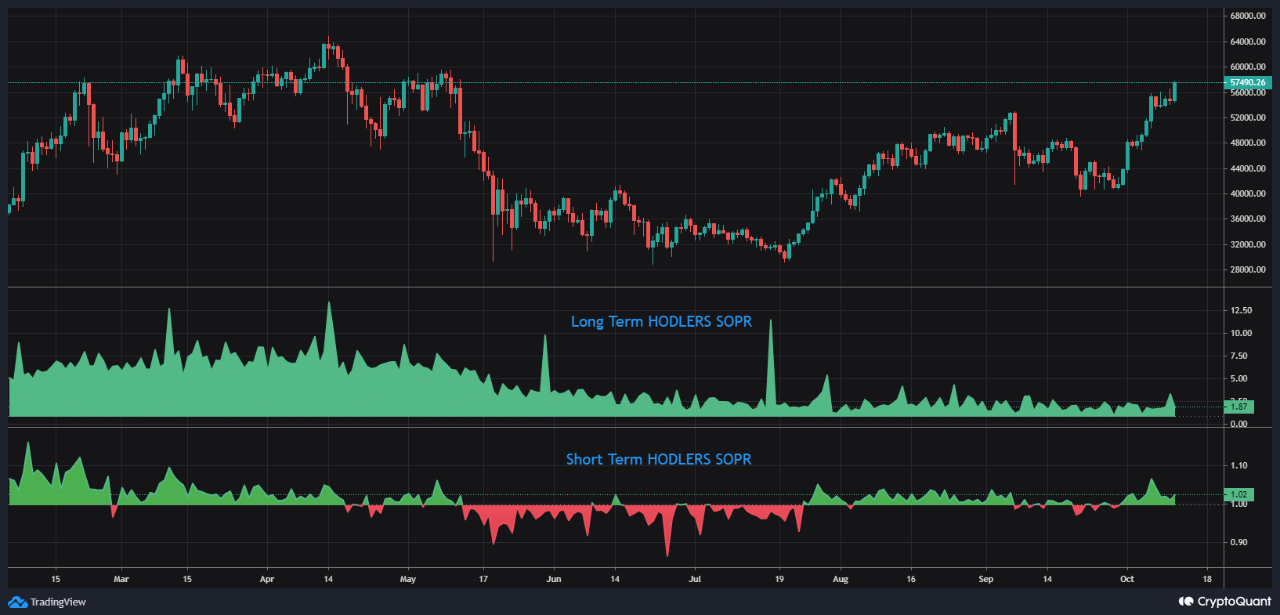
Also, it seems like both the long-term holders and short-term holders are in profit right now, as the below chart highlights:
The long-term SOPR and the short-term SOPR | Source: CryptoQuant
Both long-term and short-term Investors being in such profit means they are becoming more likely to take some profits at this level.
Related Reading | On-Chain Data Shows Bitcoin Miners Hold Off On Selling Despite BTC Rallying Above $57k
This fact combined with the rising funding rates and futures open interest makes the Quant believe that BTC could see a pullback in the short term soon.
BTC Price
At the time of writing, Bitcoin’s price floats around $56.9k, up 14% in the last seven days. Over the past thirty days, the crypto has gained 24% value.
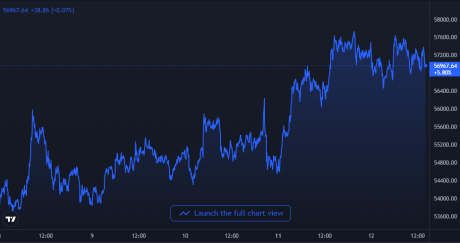
Here is a chart showing the trend in the price of BTC over the last five days:
Bitcoin's price shows a strong move up as the coin breaks $57k | Source: BTCUSD on TradingView
BTC has continued its climb up in the last few days as the coin now rallies above $57k. It’s unclear at the moment if the crypto can keep this momentum up, but if the funding rates and futures open interest is anything to go by, the market may be leading to a correction soon. Long term indicators, however, still remain bullish.
Featured image from Unsplash.com, charts from TradingView.com, CryptoQuant.com


