
Bitcoin cash price declined and retested the $220 support zone against the US Dollar. BCH is now consolidating and facing many hurdles near $226 and $230.
- Bitcoin cash price tested the $220 support level and it is consolidating losses against the US Dollar.
- The price is currently facing a strong resistance near the $230 and $231 levels.
- There is a key bearish trend line forming with resistance near $226 on the 4-hours chart of the BCH/USD pair (data feed from Kraken).
- The pair must clear the $230 resistance zone to start a fresh upward move in the near term.
Bitcoin Cash Price Holding Main Support
This past week, bitcoin cash price started a steady decline (similar to btc) below the $235 and $230 support levels. BCH even traded below the $225 support level and settled well below the 100 simple moving average (4-hours).
It tested the $220 support and formed a low at $217. It is currently consolidating losses and correcting above the $220 level. There was a spike above the 23.6% Fib retracement level of the downward move from the $246 swing high to $217 low.
However, the price is facing a lot of hurdles on the upside, starting with $225. There is also a key bearish trend line forming with resistance near $226 on the 4-hours chart of the BCH/USD pair.
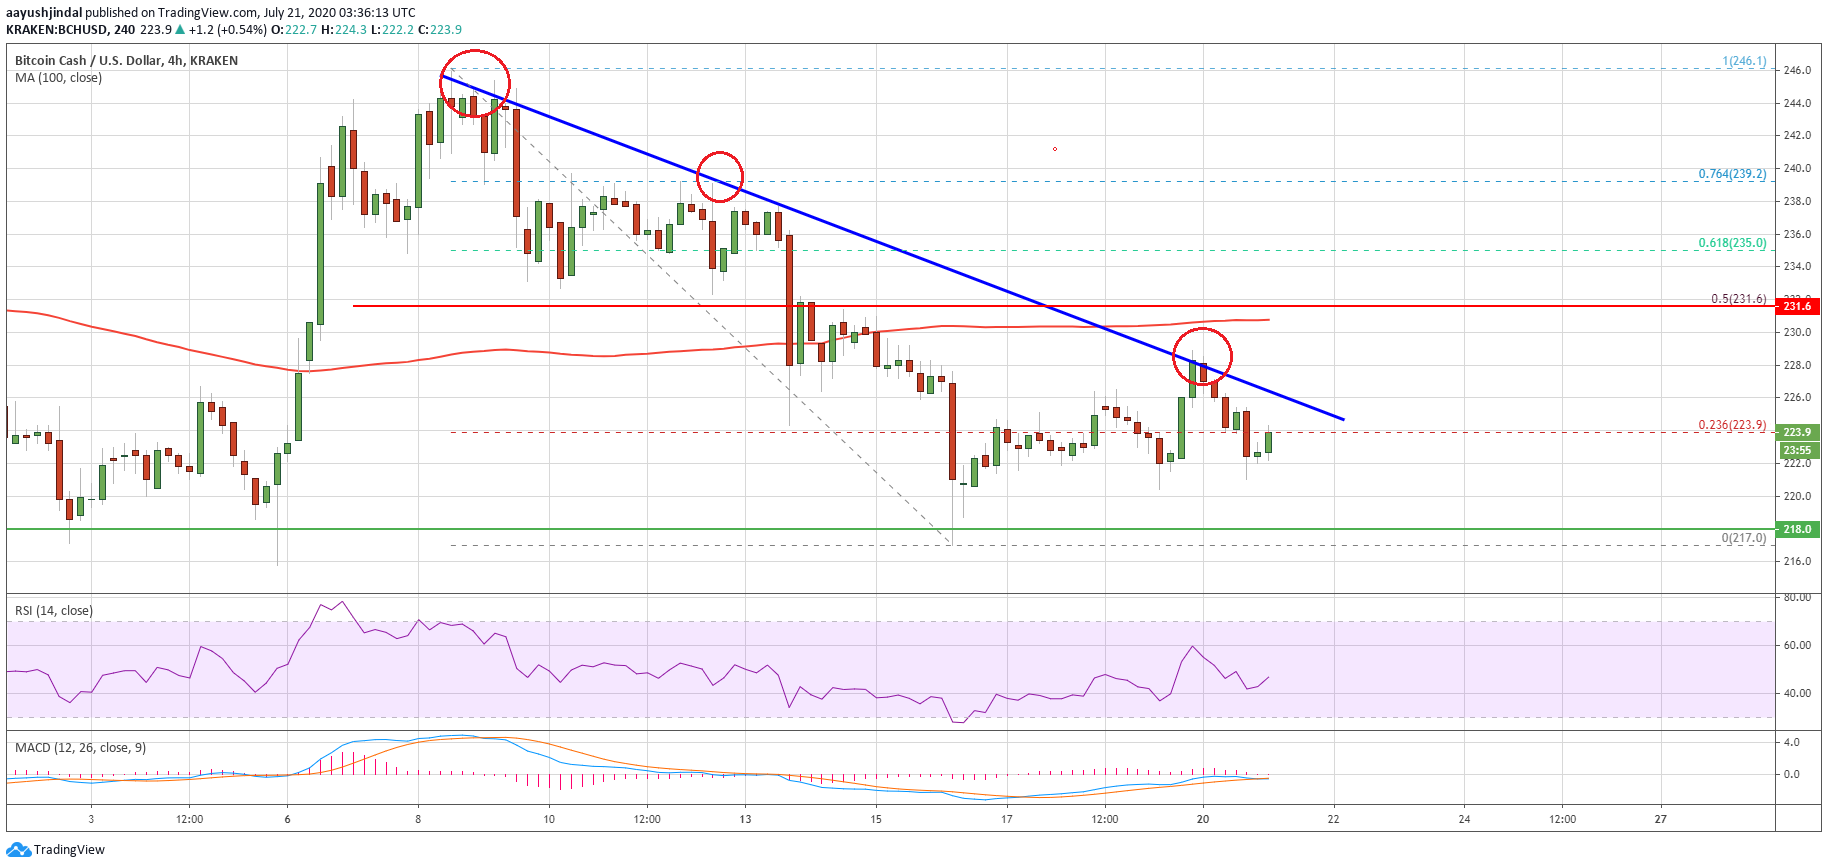
Bitcoin cash testing $225: Source: TradingView.com
The main resistance above the trend line is near the $230 level and the 100 simple moving average (4-hours). It is close to the 50% Fib retracement level of the downward move from the $246 swing high to $217 low.
A successful break above the trend line and then $230 could initiate a fresh increase. In the mentioned case, the bulls are likely to aim a retest of $245. Any further gains could push the price above the $250 resistance.
Bearish Break in BCH?
If bitcoin cash price fails to break the trend line resistance, $230, and the 100 simple moving average (4-hours), there is a risk of a major downside break.
An initial support is near the $220 level, below which the price could even trade below the $217 low. Any further losses may perhaps lead the price towards the $200 handle in the near term.
Technical indicators
Hourly MACD – The MACD for BCH/USD is now losing pace in the bullish zone.
Hourly RSI (Relative Strength Index) – The RSI for BCH/USD is currently rising towards the 50 level.
Key Support Levels – $220 and $217.
Key Resistance Levels – $226 and $230.