
Photo: QuoteInspector
Key Highlights:
- The breakout of the consolidation phase confirmed on Bitcoin market;
- in case the support level of $3,679 does not holds, $3,241 will be the BTC target;
- the bullish momentum may continue increasing.
BTC/USD Long-term Trend: Bullish
Resistance levels: $4,237, $4,692, $5,209
Support levels: $3,679, $3,257, $2,765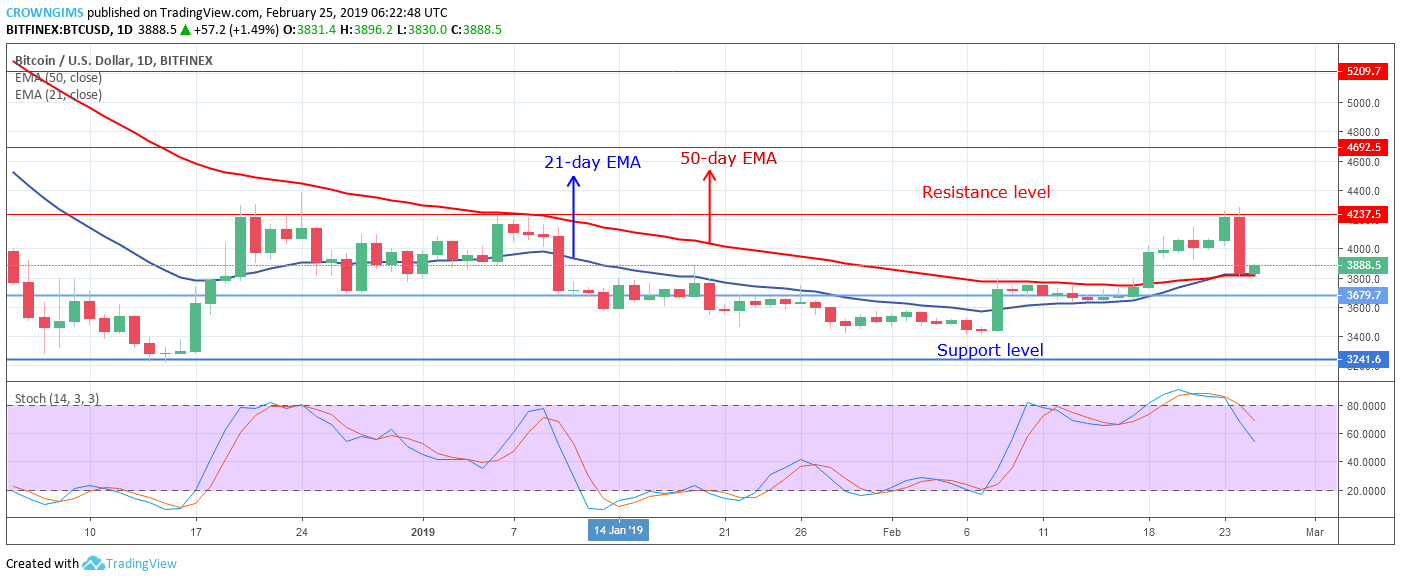
BTC/USD is bullish on the long-term outlook. Last week, the cryptocurrency broke out the confluence that faced the BTC price at $3,679. The confluence at the level was one of the reasons why Bitcoin price was consolidating around the level ten days ago.
The bullish momentum pushed the coin out of the consolidation phase on February 18 with the formation of a strong bullish candle. The bullish momentum extended towards the resistance level of $4,237 but unable to penetrate the level due to the interruption from the bears. The strong massive bearish engulfing candle formed at the resistance level of $4,237 rejected a further increase of Bitcoin price.
The BTC price is trading on the 21-day EMA and 50-day EMA in which the two EMAs are at an intersecting point about to cross each other. The Stochastic Oscillator period 14, is at 60 levels with the signal line pointing down indicate sell signal. In case the bulls were unable to defend the support level of $3,679, then, Bitcoin price will find its low at $3,241 support level.
Alternatively, in case the support level of $3,679 holds and the coin bounces the bullish momentum may raise the BTC above the $4,237 resistance level.
BTC/USD Medium-term Trend: Bearish
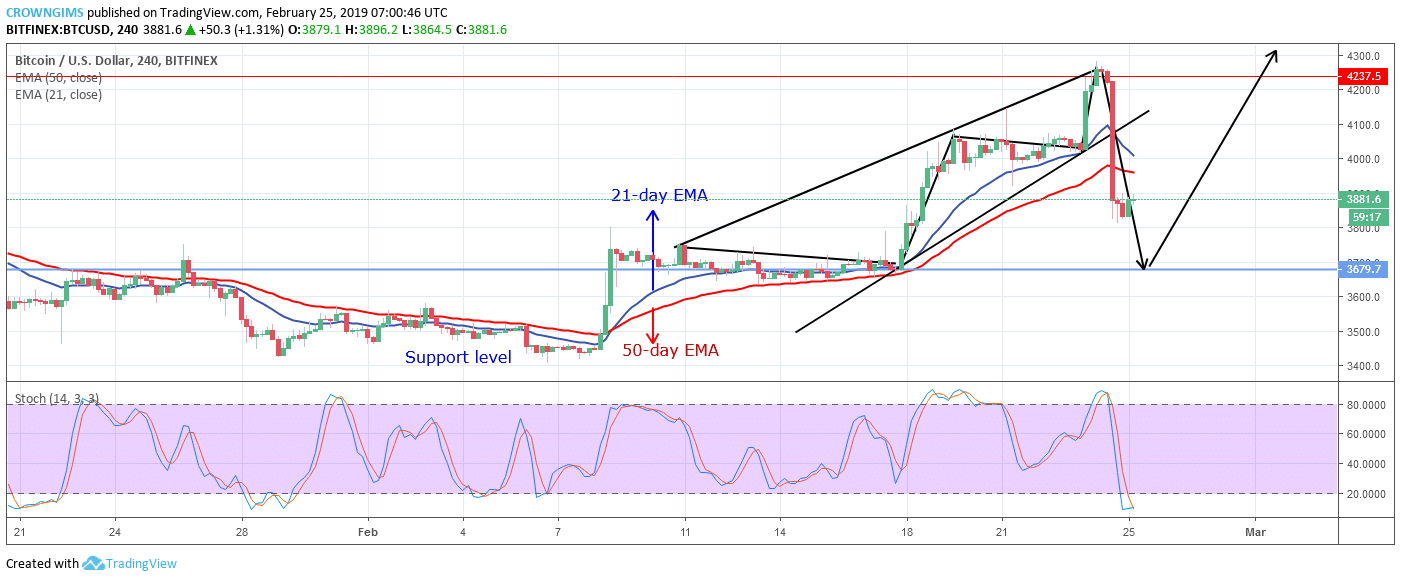
Cryptocurrency is bearish on the medium-term outlook. BTC/USD was on the bullish trend last week; the coin made higher highs movement inside the rising wedge towards the resistance level of $4,237. The Bulls lost the momentum at the level. The bears with increased momentum caused the sharp and sudden declination of BTC price. The rising wedge was broken down and Bitcoin price declined towards $3,679 support level.
The BTC price has fallen and trading below 50-day EMA while 21-day EMA is above the 50-day EMA, the Stochastic Oscillator period 14 is below 20 (oversold level) with the signal lines bending towards north indicate buy signal and the gradual increase of bullish momentum