
Despite a moral boosting altcoin recovery, most are yet to print above minor resistance levels—Litecoin, IOTA while other are still lagging—EOS and bearish. As laid out in previous trade plans, we shall only initiate positions—like in Cardano (ADA/USD) since they have a bull backing—high volumes wide trade range—once our trading conditions are true.
Let’s have a look at these charts:
EOS Price Analysis
Understandably, yesterday’s 10 percent surge could be a source of excitement. It should be. But, a look at the charts point to other things—that EOS/USD is technically bearish. We project that instead of a sharp recovery above our main resistance line at $4, EOS might consolidate within a tight $1 range before expanding towards $4.
Read: CoinBase Launches OTC Platform, Clients Still Bullish On Crypto
While this is just a theory, we recommend patience and until after there are solid moves above $4—just in line with our last EOS/USD trade plan, we shall take a neutral stance and see how this shifting sentiment could fast track recoveries invalidating our bearish outlook and igniting a new wave of longs driving price back to $5 or higher.
Litecoin Price Analysis
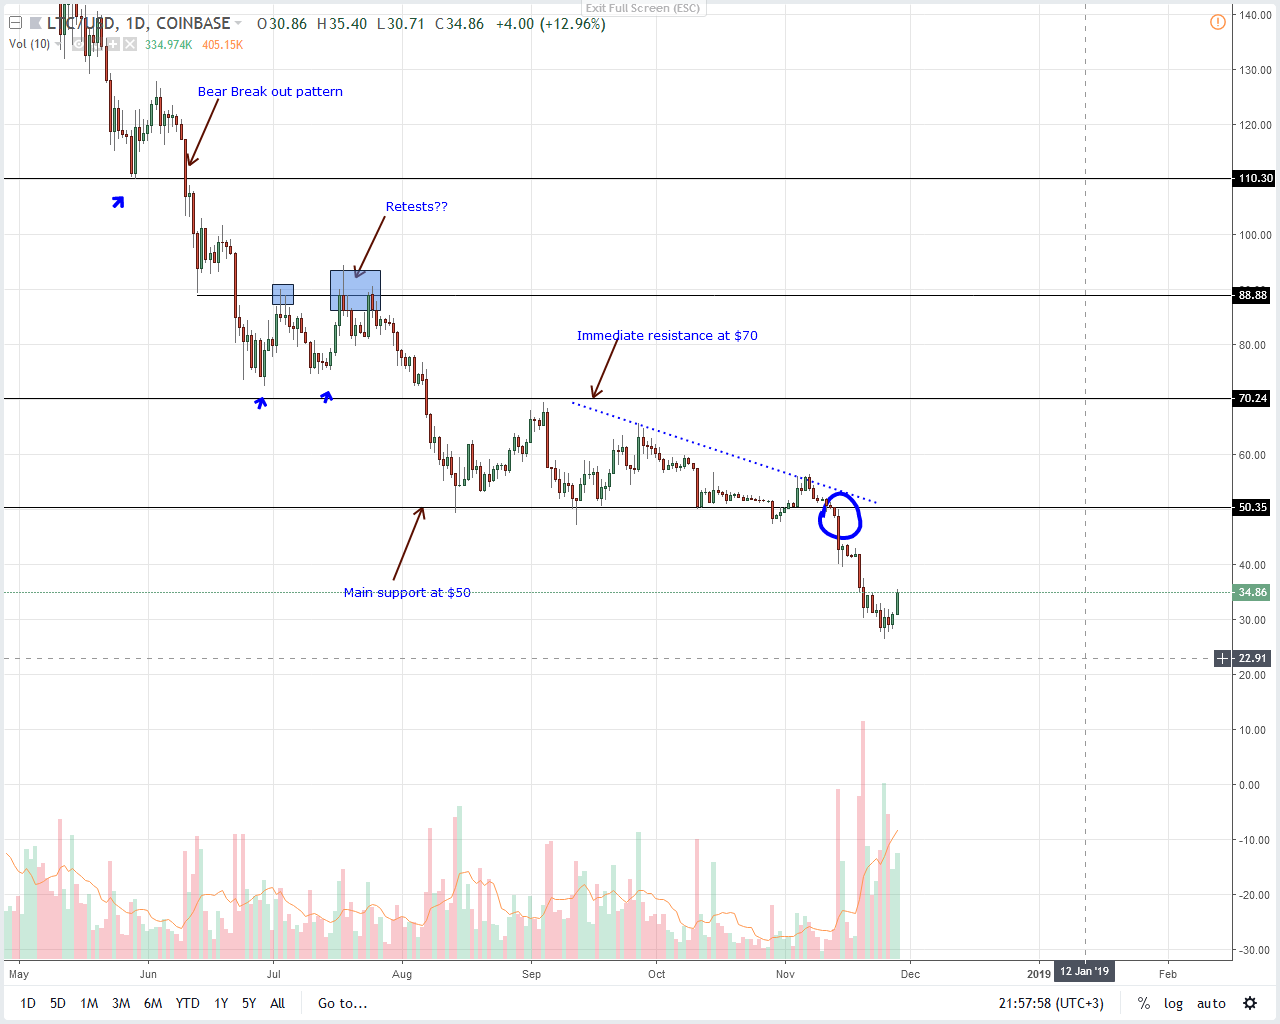
Like the rest of the market, Litecoin is finding support but not strong gains to warrant immediate shift of momentum. As far as price action is concerned, LTC is up $2 from our main support line at $33. That’s $7 from where our bull trigger at $40.
Therefore, before we recommend longs we should be aware that bears are in control. Besides, LTC is deep within a correction that even if there is a bounce, the best bulls could do is thrust prices towards the $70, our main resistance level.
Because of all these “obstacles”, it’s better off if there is a confirmation driving prices above $40 or Nov 19 highs. Thereafter we can initiate buys with targets at $70 and stops at around $35. If there is no confirmation of bulls and prices cave in closing below $30, then we shall trade according to our last LTC/USD price analysis.
Stellar Lumens Price Analysis
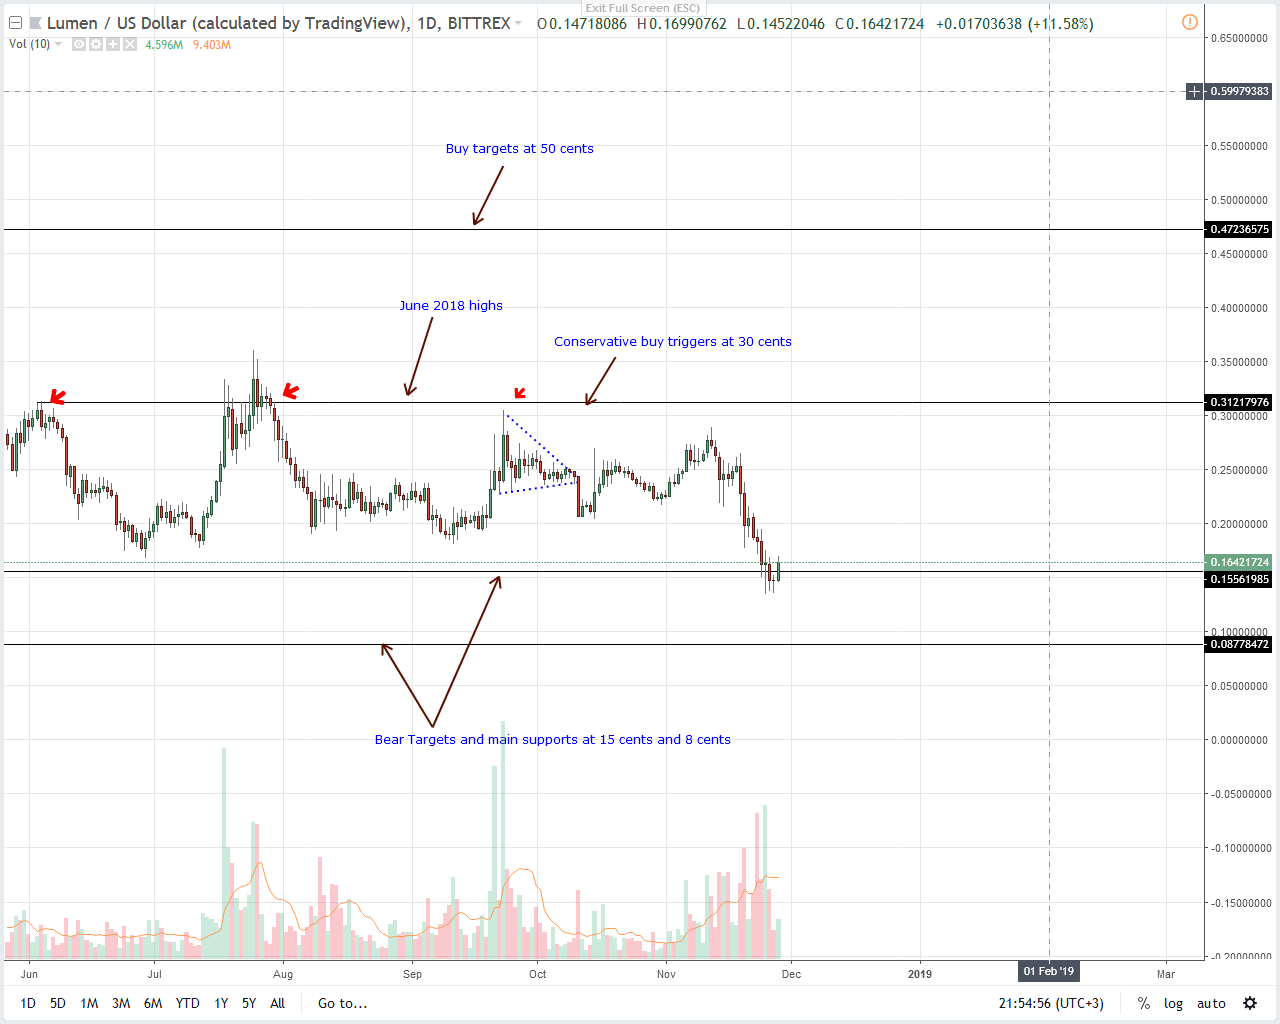
From the chart, XLM/USD is back to consolidation following yesterday’s 17 percent gain reducing weekly losses to 15 percent. Even if this is extremely positive, note that this resurgence is at the back of thin volumes as Nov 28 volumes were below average—3.9 million versus 9.3 million—meaning the level of participation is still low.
Also Read: Crypto Custody Essential for Goldman Sachs to Enter Markets
Now, for assurance, we need to see convincing follow through and that mean a strong bull bar complete with above average volumes fading the last two bears. Even with that, we shall not suggest taking buys until XLM bulls drive prices above 20 cents. From there, aggressive traders should buy on pullbacks with first targets at 25 cents and later 30 cents with stops at 15 cents.
Cardano Price Analysis
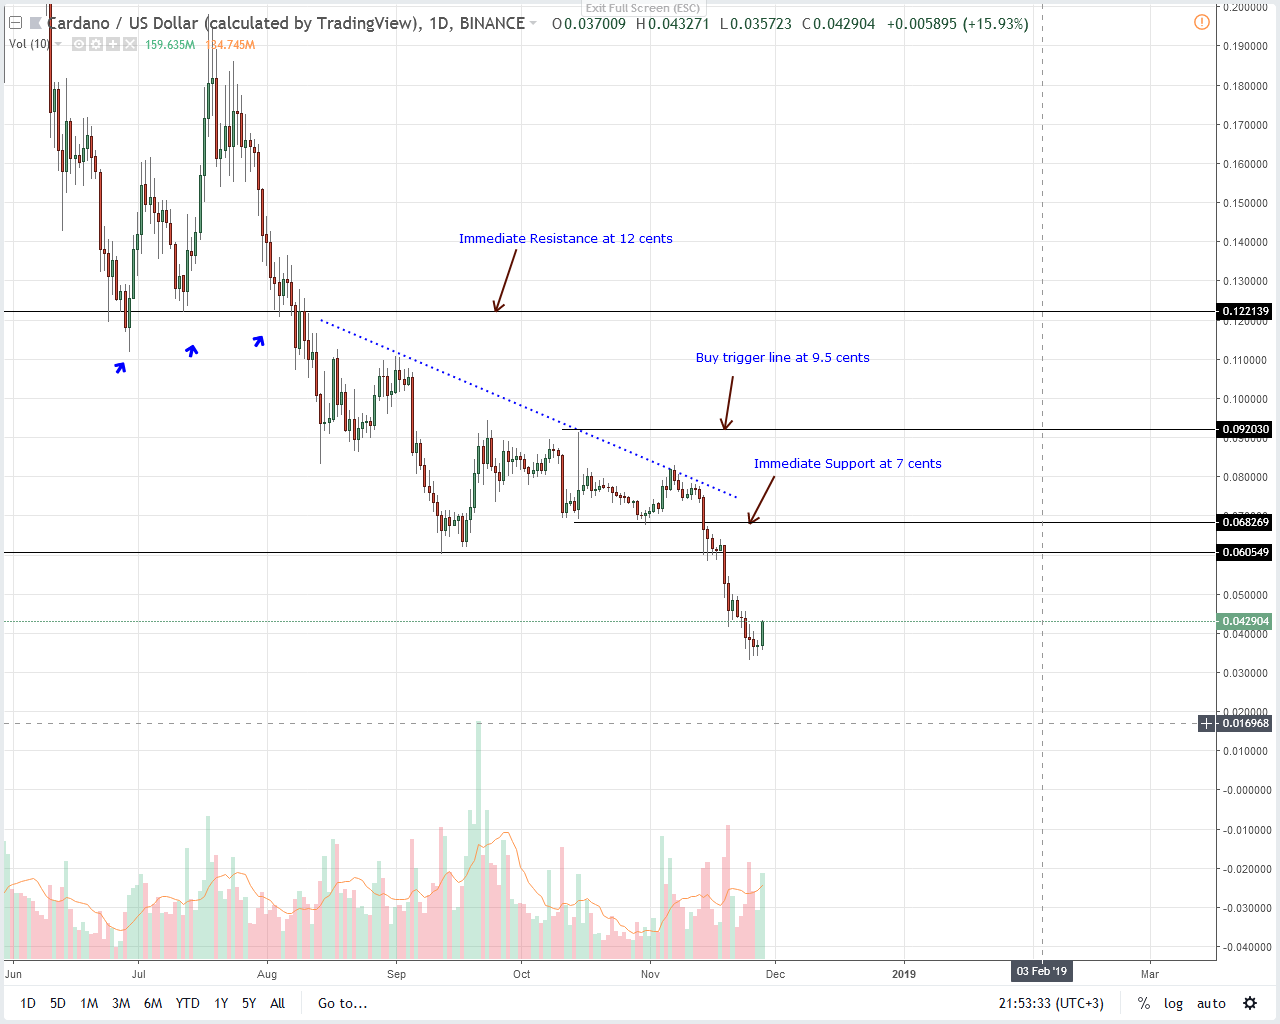
ADA is back to the top 10 after adding 15 percent in the last day. From our last Cardano price analysis, we expect to see pullbacks towards 6 cents before bears cap further gains more so if this resurgence participation is low.
As from the charts, we have a morning star pattern with above average volumes driving yesterday’s prices meaning aggressive traders should ride with the new found momentum on every dips. Ideal stops should be Nov 25 lows of 3.3 cents and first targets at 6 cents.
IOTA Price Analysis
Thing is, there are many use cases around the internet of things and this could be driving IOT demand. At spot prices it is up 15 percent and 13th in the liquidity table though the foundation did sign a MoU with a Taiwanese University and Tangle could end up being used by a startup—Iberian— that wants to manage a $65.7 trillion asset management industry.
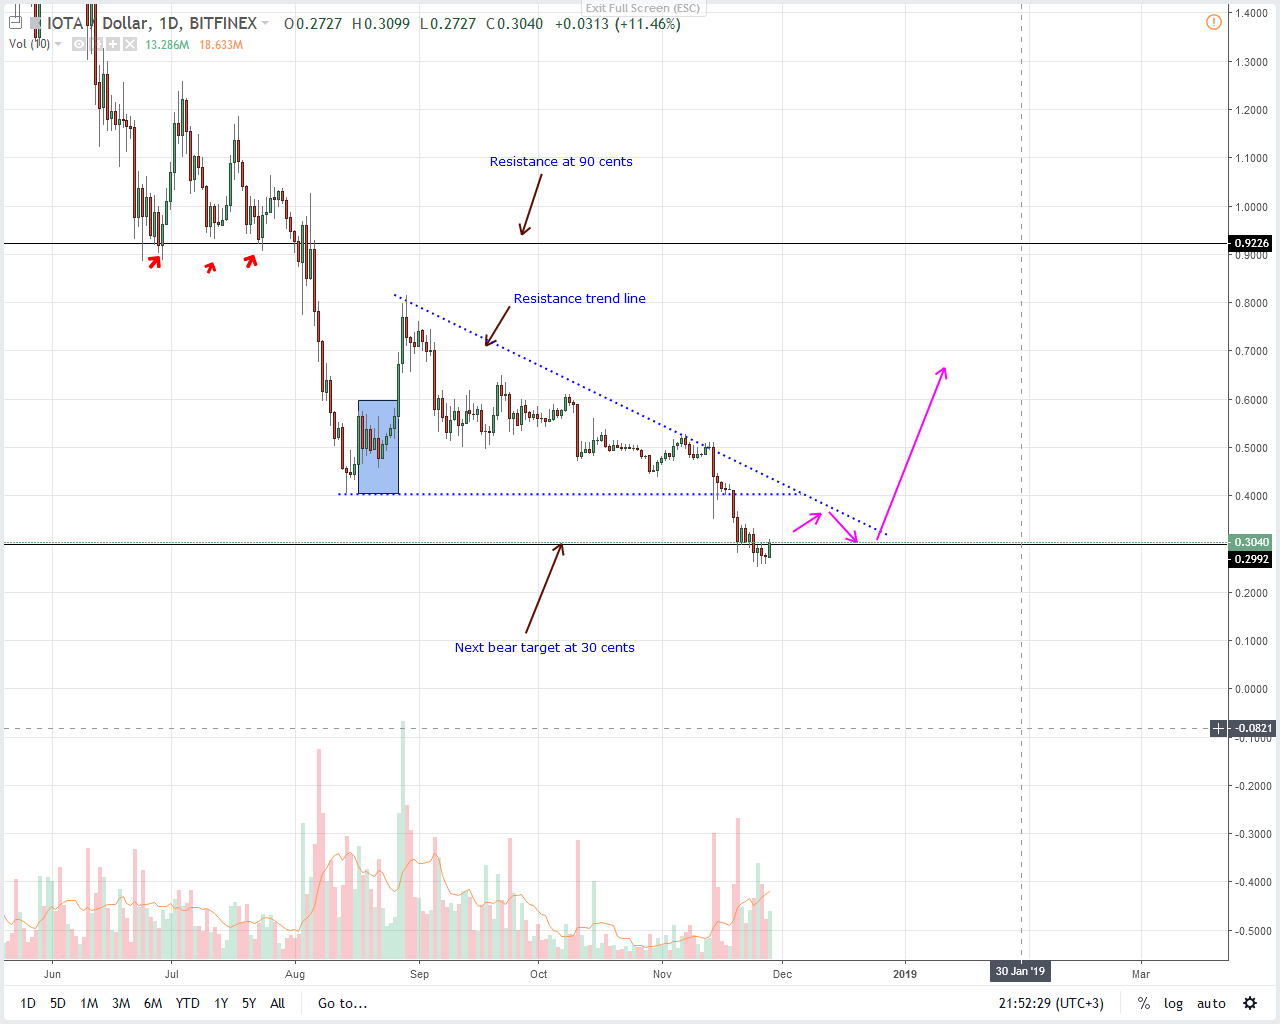
On to the chart, IOT/USD did find support from 30 cents and could edge higher today confirming a three bar reversal pattern and igniting short term buys with targets at 50 cents once bulls print above Nov 24 highs of 33 cents.
Ideally, what we want to see is price surges accompanied by volume spikes driving prices above the minor resistance trend line. Once this print, we shall suggest buying on dips with first targets at 50 cents and later 90 cents.
All Charts Courtesy of Trading View
Disclaimer: Views and opinions expressed are those of the author and aren’t investment advice. Trading of any form involves risk and so do your due diligence before making a trading decision.