

Ethereum is currently consolidating above the $210 level against the US Dollar. ETH price is still struggling to clear the $215 and $216 resistance levels.
- Ethereum is facing an uphill task near the $215 and $216 resistance levels.
- A strong support is forming above $208 and the 100 hourly simple moving average.
- There is a key breakout pattern forming with resistance near $215 on the hourly chart of ETH/USD (data feed via Kraken).
- The pair likely approaching a major break and it could either rally above $216 or decline sharply to $200.
Ethereum Price Consolidating Gains
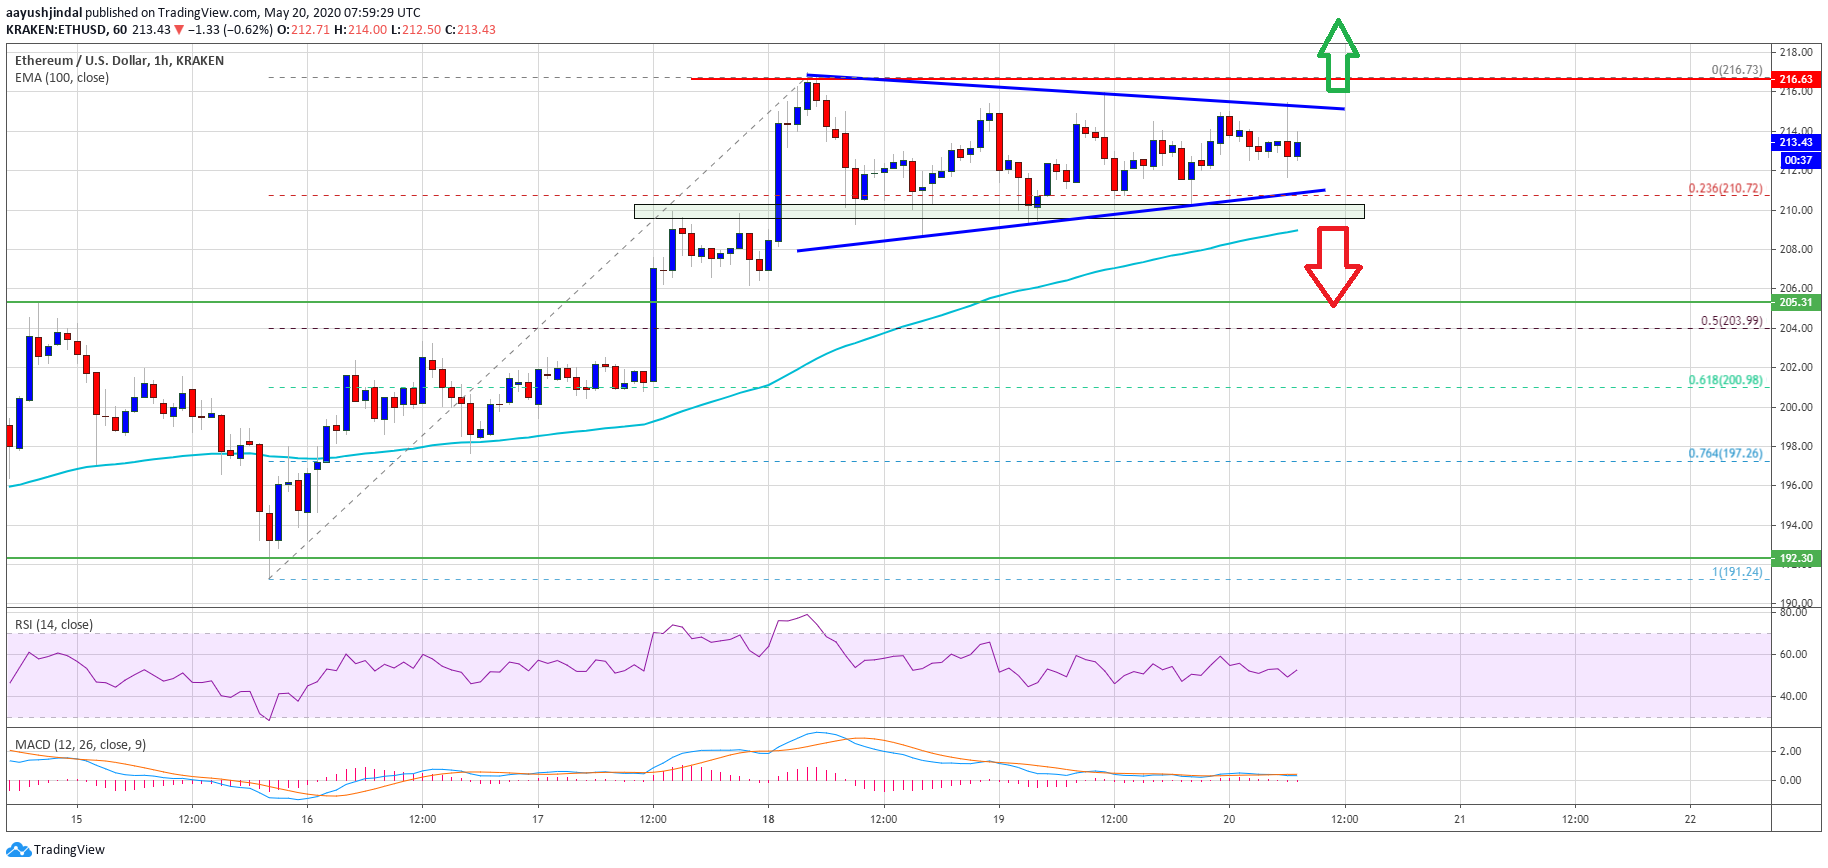
Ethereum price remained in a tight range below the $216 resistance zone against the US Dollar. This week’s swing high was formed near $216 before ETH price started consolidating gains.
There was a minor decline below the $212 and $210 levels. The price even spiked below the 23.6% Fib retracement level of the upward move from the $191 low to $216 high.
However, the $208 zone acted as a strong support along with the 100 hourly simple moving average. It seems like there is a key breakout pattern forming with resistance near $215 on the hourly chart of ETH/USD.
To start a strong increase and a fresh rally, ether price must surpass the $215 and $216 resistance levels. A successful break above the $216 level and a follow through above $220 might open the doors for a larger wave towards the $230 and $240 levels in the near term.
Bearish Break?
If Ethereum fails to clear the $215 and $216 resistance levels, there could be a bearish reaction. An initial support on the downside is near the $208 level and the 100 hourly simple moving average.
The main uptrend support is near the $205 zone. It is close to the 50% Fib retracement level of the upward move from the $191 low to $216 high. If the price fails to stay above the $205 support zone, it may perhaps extend its decline towards the $200 level.
Any further losses could push the bears to gain traction and the price may perhaps decline towards the $192 support zone.
Technical Indicators
Hourly MACD – The MACD for ETH/USD is showing signs of a strong bullish break.
Hourly RSI – The RSI for ETH/USD is currently above the 50 level, with a bullish angle.
Major Support Level – $208
Major Resistance Level – $216
Take advantage of the trading opportunities with Plus500
Risk disclaimer: 76.4% of retail CFD accounts lose money.


