- Ripple price climbed higher, but it failed near the $0.3100 resistance area against the US dollar.
- There is a new connecting bullish trend line formed with support at $0.3000 on the hourly chart of the XRP/USD pair (data source from Kraken).
- The pair could break the $0.3000 support and accelerate losses towards $0.2910 in the near term.
Ripple price remained below key resistances against the US Dollar and Bitcoin. XRP/USD may correct higher, but upsides are likely to face a strong selling interest near $0.3100.
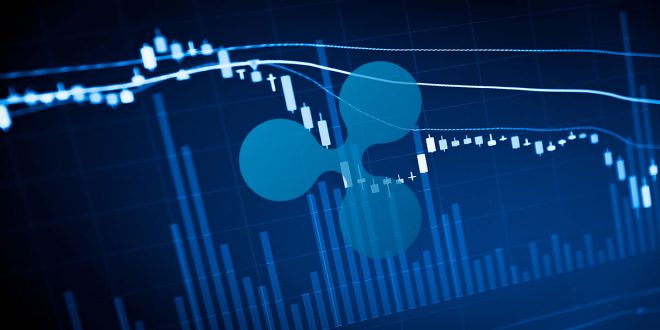
Ripple Price Analysis
In the past couple of days, there were bearish moves in ripple price below the $0.3120 pivot against the US Dollar. The XRP/USD pair made two attempts to surpass the $0.3100 and $0.3120 resistance levels, but it failed. On the other hand, bitcoin and Ethereum remained in the bullish zone above $3,550 and $120 respectively. Recently, there was an upward move above the $0.3050 level and the 100 hourly simple moving average. However, sellers protected gains near $0.3100 and a high was formed at $0.3094. Later, there was a sharp bearish reaction and the price declined below the $0.3040 support.
There was even a close below $0.3040 and the 100 hourly simple moving average. The price also traded below the 61.8% Fib retracement level of the last leg from the $0.2940 low to $0.3094 high. Somehow, buyers were able to protect the $0.3000 support area. The 76.4% Fib retracement level of the last leg from the $0.2940 low to $0.3094 high also acted as a support. At the outset, the price is trading just above the $0.3000 support, with a bearish angle. More importantly, there is a new connecting bullish trend line formed with support at $0.3000 on the hourly chart of the XRP/USD pair. If there is a downside break below the trend line and $0.2980, there could be more losses. The next support is positioned near the $0.2910 level. Additionally, the 1.236 Fib extension level of the last leg from the $0.2940 low to $0.3094 high is also near $0.2910.
Looking at the chart, ripple price is clearly struggling to stay above the $0.3000 support area. Should sellers gain momentum, there is a risk of more losses towards $0.2915 and $0.2905. On the upside, the main hurdles for buyers are near $0.3040, $0.3050, $0.3090 and $0.3100. A close above $0.3100, followed by a follow through above $0.3120 is needed for a bullish acceleration.
Technical Indicators
Hourly MACD – The MACD for XRP/USD is showing a few negative signs in the bearish zone.
Hourly RSI (Relative Strength Index) – The RSI for XRP/USD moved below the 50 level, with a bearish angle.
Major Support Level – $0.2980
Major Resistance Level – $0.3040
If You Liked This Article Click To Share