For the past week, Bitcoin (BTC) price has been flirting with the $20,000 mark, which has led some traders to lose their patience. In the eyes of some traders, the lack of bullish momentum is problematic, especially considering that BTC tested the $16,200 level roughly a week ago.
Experienced traders know that there are key indicators that serve as telling signs of a trend reversal. These are volumes, the futures premium, and top traders’ positions at major exchanges.
A handful of negative indicators will not precede every dip, but there are some signs of weakness more often than not. Every trader has their own system, and some will only act if three or more bearish conditions are met, but there is no set rule for knowing when to buy or sell.
Futures contracts should not trade below spot exchanges
Some websites host trading indicators that claim to show the long-to-short ratio for various assets, but in reality, they are simply comparing the volume of the bids and offers stacked.
Others will refer to the leaderboard data, therefore monitoring accounts that did not opt-out from the ranking, but this is not accurate.
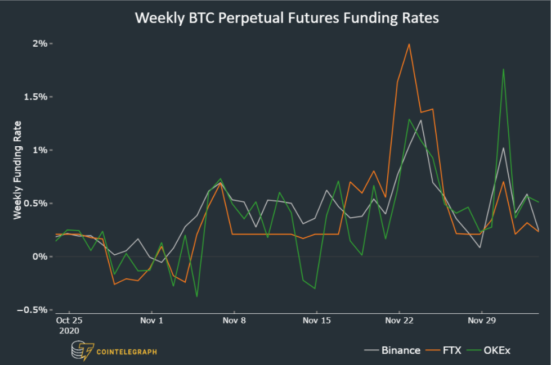
A better method is to monitor the perpetual futures (inverse swap) funding rate.
The open interest of buyers and sellers of perpetual contracts is matched at all times in any futures contract. There is simply no way an imbalance can happen, as every trade requires a buyer (long) and a seller (short).
Funding rates ensure there are no exchange risk imbalances. When sellers (shorts) are the ones demanding more leverage, the funding rate goes negative. Therefore, those traders will be the ones paying up the fees.
Sudden shifts to the negative range indicate a strong willingness to keep short positions open. Ideally, investors will monitor a couple of exchanges simultaneously to avoid eventual anomalies.
The funding rate might bring some distortions as it’s the preferred instrument of retail traders and, as a result, is impacted by excessive leverage. Professional traders tend to dominate longer-term futures contracts with set expiry dates.
By measuring how much more expensive futures are versus the regular spot market, a trader can gauge their bullishness level.
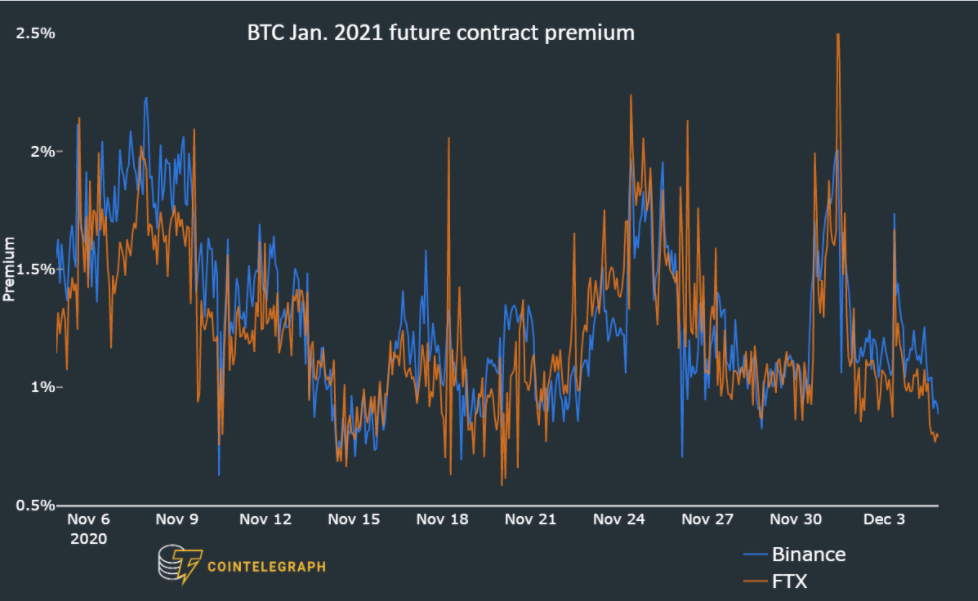
Take notice of how the fixed-calendar futures should usually trade with a 0.5% or higher premium versus regular spot exchanges. Whenever this premium fades or turns negative, this is an alarming red flag. Such a situation, also known as backwardation, indicates strong bearishness.
Monitoring volume is key
In addition to monitoring futures contracts, good traders also track volume in the spot market. Breaking important resistance levels on low volumes is somehow intriguing. Typically, low volumes indicate a lack of confidence. Therefore significant price changes should be accompanied by robust trading volume.
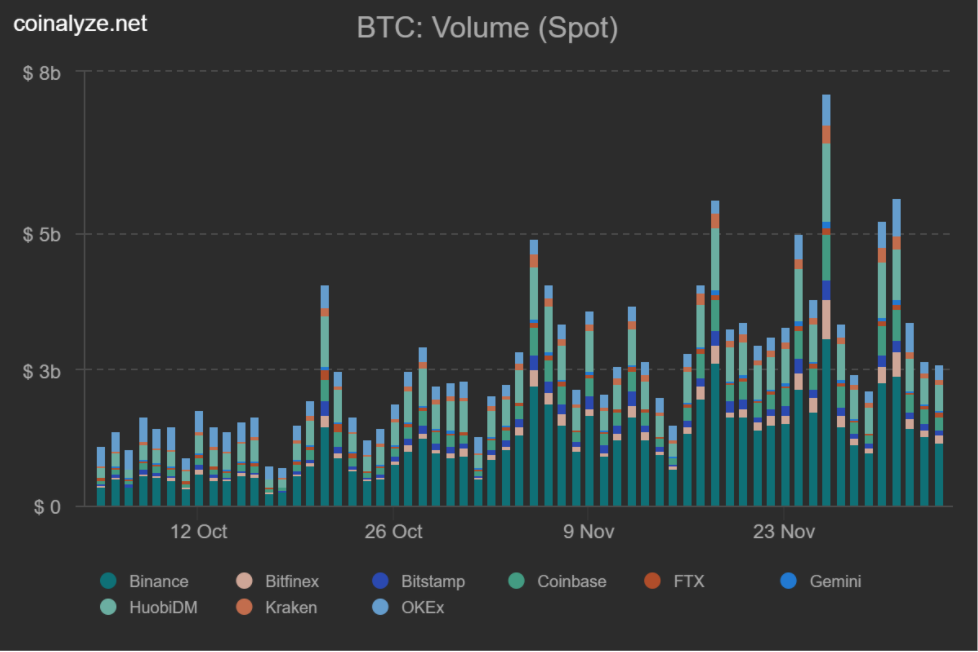
Although the recent volumes have been above average, traders should remain skeptical of significant price swings below $3 billion in daily volume, especially considering the past 30 days.
Based on the past month of data, the volume will be a fundamental metric to watch as traders attempt to push Bitcoin price through the $20,000 level.
Top traders long-to-short ratio can anticipate price changes
Another key metric savvy investors monitor is the top traders’ long-to-short ratio that can be found at leading crypto exchanges.
There are often discrepancies between exchanges’ methodology, so readers should monitor changes instead of absolute figures.
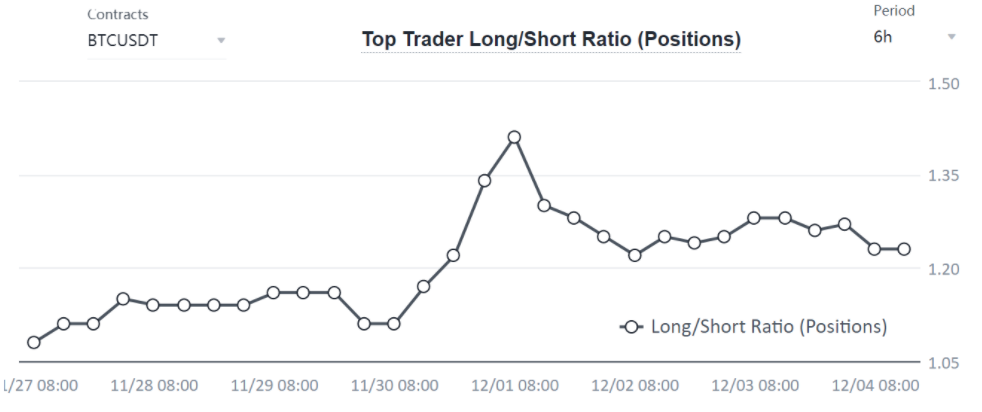
A sudden move below the 1.00 long-to-short ratio would be a troubling signal in the above example. This is because historical 30-day data and the current 1.23 figure favor longs.
As previously mentioned, the ratio can differ significantly between exchanges, but this effect can be neutralized by avoiding direct comparisons.
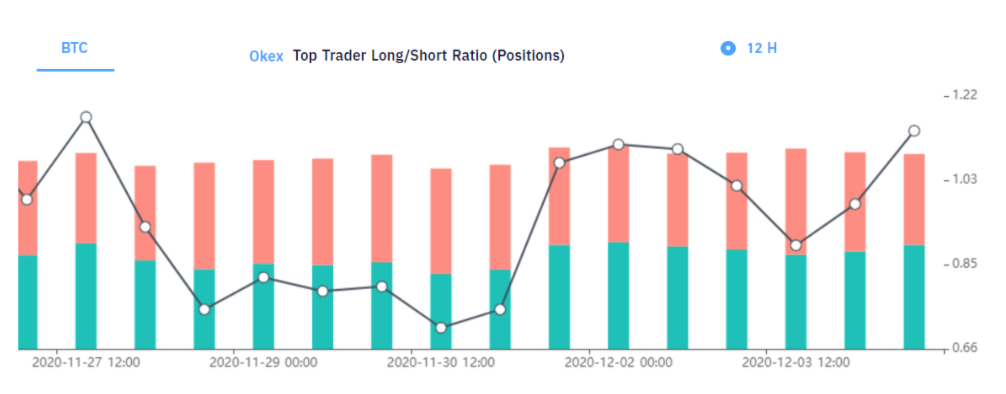
Unlike Binance, it is common for OKEx top traders to hold levels below 1.00, albeit not necessarily indicating bearishness. According to its 30-day data, numbers below 0.75 should be considered worrisome.
There is no set rule or method for predicting large dips as some traders require that multiple indicators turn bearish before they enter short positions or close their long positions.
With that said, monitoring the funding rate, spot volumes, and the top traders’ long-to-short ratio provides a much clearer view of the market than simply reading candlestick patterns and general oscillators like the Relative Strength Index and Moving Average Convergence Divergence.
This is because the metrics discussed provide a direct gauge of professional traders’ sentiment, and it is crucial to have a clear view of this as BTC tries to break $20,000.
The views and opinions expressed here are solely those of the author and do not necessarily reflect the views of Cointelegraph. Every investment and trading move involves risk. You should conduct your own research when making a decision.