
The total crypto market cap lost $23.1 billion of its value for the last seven days and now stands at $246.2 billion. The top 10 currencies are mostly in red for the same time period with Bitcoin (BTC) being the worst performer with 9 percent loss while Tezos (XTZ) added 2.9 percent. By the time of writing bitcoin is trading at $8,780 while Ether (ETH) dropped down to $201. Ripple’s XRP nears $0.193.
BTC/USD
Bitcoin continued to rise on Sunday, May 17, and ended the week at $9,661 or 12.5 percent higher compared to the previous seven-day period. The coin successfully moved above both the horizontal resistance at $9,600 and the long-term downtrend line acting as a major diagonal resistance.
Naturally, the next target for bulls was to consolidate and break out of the symmetrical triangle pattern, which is in the making since February.
The BTC/USD pair started trading on Monday by extending its gains to $9,718. The session was quite volatile and we saw the price moving in the $9,457 -$9,970 range, hitting the upper-level of the symmetrical triangle at some point.
On Tuesday, May 19 the leading cryptocurrency formed its fourth consecutive green candle on the daily chart and climbed up to $9,794.
The mid-week session on Wednesday, however, was slightly different as bears managed to take over control. Bitcoin experienced a short correction to the downside and dropped down to $9,508 erasing 2.7 percent of its value. Still, it remained stable around the major support zone.
Bitcoin continued to slide on Thursday, May 21 breaking below the long-term downtrend and reaching the sub-$9,000 levels during intraday. The coin lost 4.5 percent in the sudden drop and closed at $9,066.
The last day of the workweek saw bitcoin rebounding from the psychological level of $9,000 and moving up to $9,158. It hit the diagonal resistance without being able to surpass it.
The trading session on Saturday, May 23, was relatively calm with no change in the price direction or sentiment. On Sunday, the BTC/USD pair once again attempted an attack of the long-term downtrend but failed for a third straight day, which led to a huge red candle to $8,703 and 5.2 percent loss.
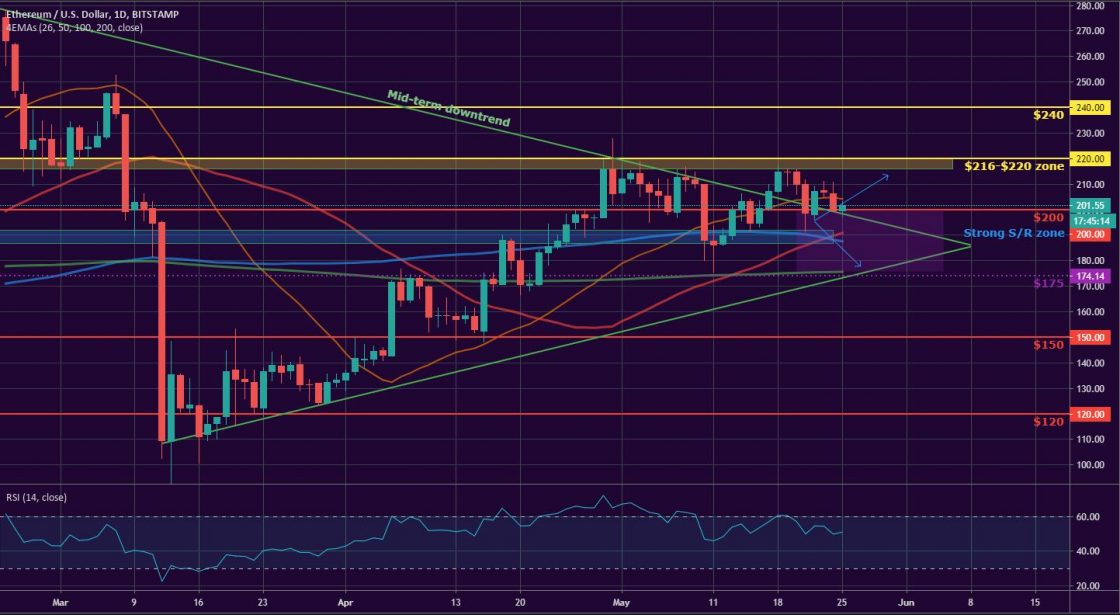
ETH/USD
The Ethereum Project token ETH climbed to $207 or right above the diagonal resistance (mid-term downtrend line) on Sunday, May 17. It was 10.6 percent up on a weekly basis.
The coin formed its third consecutive green candle on the daily chart on Monday and climbed up to $214. It even hit the next target zone up during intraday – $216-$220. As already mentioned in our reports, this area is as equally important as $200. It is where the 61.80 Fibonacci retracement level is situated for the mid-term downtrend and the ETH/USD pair was already rejected there once in April.
On Tuesday, May 19, the ether was stopped near that level but remained flat for the day.
The third day of the workweek was not that positive for bulls and the price was corrected down to $209. Still, the bear pressure looked relatively weak as ETH has been easily recovering in the evening part of the sessions.
On Thursday, May 21, however, the coin made another leg down and dropped to $198, losing 5.7 percent. The move resulted in breaking the important support level as bears were even able to push the price down to the $190 S/R line during intraday.
Bulls woke up on Friday and built up a solid green candle to $206 regaining their positions above both the horizontal and diagonal resistance as well as the fast EMA.
The first day of the weekend was marked by low activity as the ether stayed flat on Saturday, but then on Sunday it started to loosing round and fell to $200.
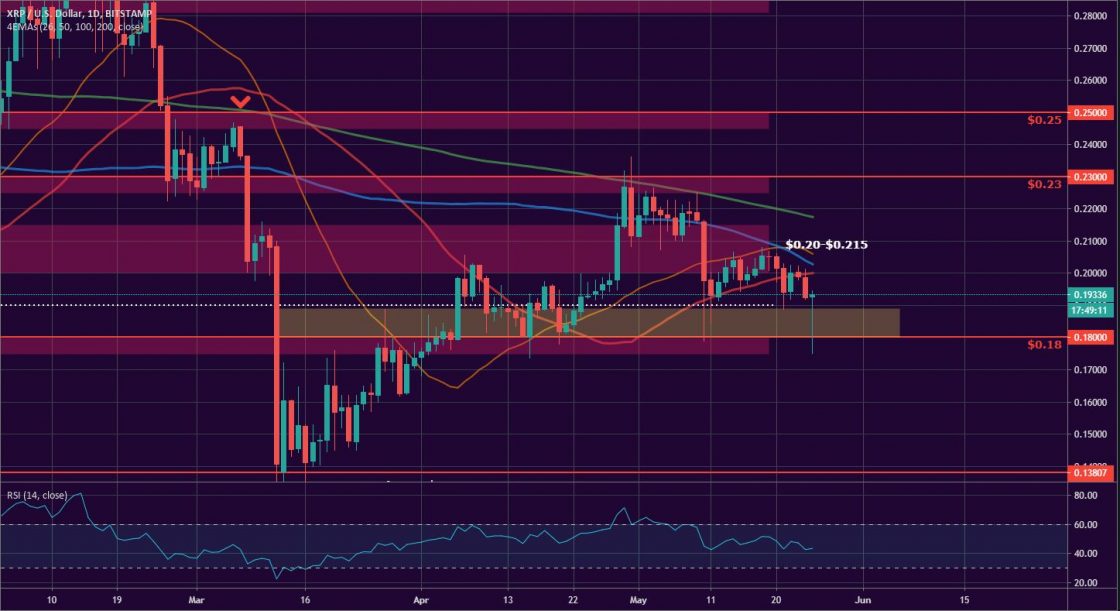
XRP/USD
The Ripple company token XRP continued with its good performance on Sunday, May 17, and closed the week at $0.201 or 4.1 percent higher compared to the previous seven-day period.
The XRP/USD pair remained in the wider $0.18-$0.23 area where it is ranging for more than a month now without showing any signs of a breakout in either direction. It started trading on Monday by forming a third consecutive green candle on the daily chart, this time to $0.205. Bulls were stopped at the 26-day EMA, which was still acting as a dynamic resistance.
On Tuesday, May 19 we witnessed a high volatility session that ended with no significant price change.
The mid-week session on Wednesday, however, was the beginning of a correction phase for the major altcoin. It dropped down to $0.201 and lost 2 percent of its value.
The reversal to the downside was confirmed on Thursday, May 21. The “ripple” fell further to $0.193 breaking below both the 50-day EMA and the $0.20 S/R line. The move resulted in another 4 percent loss. Bears were even able to push the price all the way down to the next support zone around $0.19 during intraday.
The last day of the workweek was marked by the return of bulls. They managed to regain some positions and the XRP token closed the session at $0.199.
The weekend of May 23-24 started with a small drop to $0.198 on Saturday as the price was now hovering around the 50-day EMA.
On Sunday, we saw a further decline to $0.192. as the altcoin closed the seven-day period with 4.4 percent loss.
Altcoin of the Week
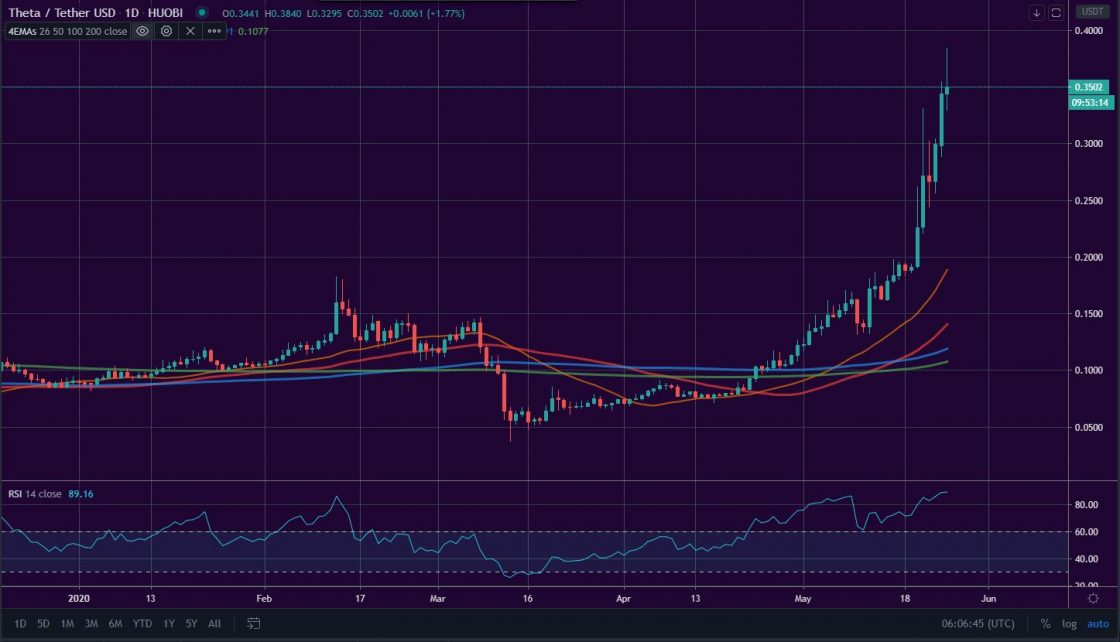
Our Altcoin of the week is Theta Network (THETA). The decentralized video streaming platform added 72 percent to its price for the last seven days and doubled in value for the two-week period.
THETA peaked at $0.36 on Sunday, May 24, and currently stands at #28 on CoinGecko’s Top 100 list with a total market capitalization of approximately $323 million.
The reason for the surge is without a doubt the upcoming MainNet 2.0 and Guardian Node software launch, which is expected to happen to come Wednesday, May 27.
As of the time of writing, the coin is trading at 0.35 against USDT on Huobi.
Like BTCMANAGER? Send us a tip!
Our Bitcoin Address: 3AbQrAyRsdM5NX5BQh8qWYePEpGjCYLCy4