

Bitcoin on Monday maintained its bullish bias despite facing rejection by a strong resistance area.
The bitcoin-to-dollar exchange rate surged from $3,956 to $4,244 as the Asian session kicked in. The pair attempted a breakout action but got held by a moderate selling pressure near the session peak. By the European session, an interim bearish correction has brought bitcoin to its session low near $4,022. At press time, the Bitcoin/Dollar rate again is going through a minor accumulation period, which could enable the pair to retest $4,244 for a potential breakout.
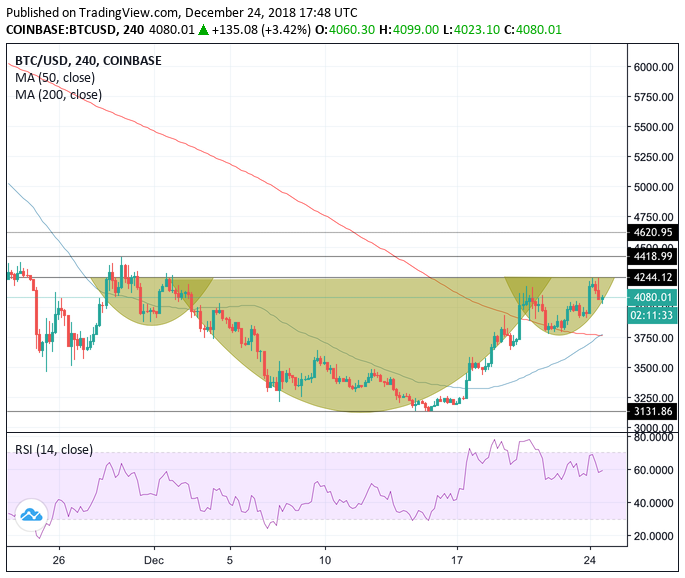
Technically, bitcoin price has completed its inverse head and shoulder scenario with its neckline tied around $4,244. As the coin consolidates below this level, the likelihood of an extended downside correction is more. In the event of a breakout, the price could set its targets towards $4,418-4,500 area in the interim scenario, bringing adequate opportunities for small profits.
The 4H chart is also displaying a Goldern Cross scenario. The candlestick pattern is formed when a near-term moving average jumps above a long-term moving average. As of now, the 50-period moving average is clearly crossing above the 200-period moving average, confirming a breakout scenario for the bitcoin-dollar pair. On a daily chart, at the same time, the 50-period remains much below the 200-period, confirming that the breakout action – if it takes place – would not confirm an out-and-out bullish bias in long-term.
The RSI momentum indicator confirms a bullish presence after finding buyers in the 50-60 area. In the wake of the aforementioned bullish indicators, there is a likelihood for the RSI to attempt a go at the overbought area.
Meanwhile, the quoted dollar looked weaker on Monday, over a partial government shutdown in the US. Its impact on the bitcoin market cannot be identified at press time.
Bitcoin/Dollar Intraday Targets
Using the same chart above, we have defined our today’s range by $4,244 as interim resistance and $3,976 as interim support.
Our day begins by entering a long position towards $4,244 with plans to extend it on a breakout action, towards $4,500, our psychological upside target. As we pursue the bullish sentiment, we would maintain our stop loss just 1-pip below our entry position. It would ensure that we don’t lose much should there be a sign of an extended downside correction.
In case bitcoin confirms $4,244 as resistance and reverses, then we will open a short position towards $3,976 while eyeing the 50-period moving average as our potential downside target. As usual, we would maintain our stop-loss order just 1-pip above the entry position to manage our risks efficiently.
Featured image from Shutterstock.
Get Exclusive Crypto Analysis by Professional Traders and Investors on Hacked.com. Sign up now and get the first month for free. Click here.

