

View
- Bitcoin created a “spinning-top” candle on Wednesday, pouring cold water over the optimism generated by the triangle breakout witnessed earlier this week.
- The spinning top has made today’s UTC close pivotal. A close above Wednesday’s high of $10,834 is needed for the continuation of the recent rally.
- A UTC close below the spinning top’s low of $100,378 would shift risk in favor of deeper losses below $10,000.
- A bearish daily close shouldn’t be ruled out, as the spinning top represents buyer exhaustion.
The bitcoin (BTC) market is looking indecisive, after witnessing a solid two-way business in the last 24 hours. Today’s UTC close will likely determine the next move.
The top cryptocurrency by market value picked up a bid at lows below $10,400 around 13:45 UTC on Wednesday and rose above $10,800 at 20:00 UTC, according to Bitstamp data.
Tuesday’s high-volume move had set the tone for a test of the bearish lower high of $10,956, as discussed yesterday.
The bullish move, however, ran out of steam at a 15-day high of $10,834 in the U.S. trading hours yesterday and prices fell back at the UTC close at $10,586 – down just $0.30 percent on the day.
Essentially, BTC created a spinning-top candle on Wednesday, which comprises of a small body, representing marginal gains or losses on the day and long wicks, representing two-way price action.
The spinning top is widely considered a sign of indecision in the market place – with neither bulls nor bears being in a commanding position.
In such situations, experienced traders often wait on the sidelines till a strong directional move emerges. So far, BTC has not shown any signs of directional strength – the cryptocurrency is consolidating around $10,600 on Bitstamp.
Daily chart
The spinning-top candle has taken the shine off the triangle breakout witnessed earlier this week and has made today’s UTC close pivotal.
A close above the candle’s high of $10,834 would imply a continuation of the rally from the recent low of $9,320.
A more reliable indicator of bullish revival would be a UTC close above the lower high of $10,956 created on Aug. 20. A bullish close above $10,956, if confirmed, would open the doors to $12,000.
Meanwhile, a close below the spinning top’s low of $10,378 would indicate that the rally from the recent low of $9,320 has ended and the bears have regained control. That could yield a sell-off back to $9,755 (Aug. 22 low).
With the moving average convergence divergence (MACD) histogram reporting bullish conditions (an above-50 reading), observers may feel tempted to predict a bullish daily close.
However, it may be foolish to rule out a bearish close, as the spinning top candle has appeared following a $1,500 rally, and the indecision predominantly represents bullish exhaustion. If the bulls were strong, the spinning top would not have appeared. Hence, a correction could be around the corner.
BTC is also looking heavy on the intraday charts.
Hourly chart
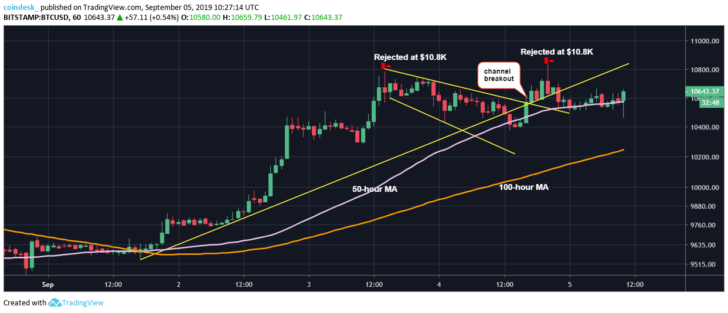
BTC has found acceptance below the bullish trendline, having faced rejection around $10,800 twice in the last 48 hours.
More importantly, a falling channel breakout seen yesterday failed to accelerate the preceding bullish move – a sign of bullish exhaustion. The 50-hour moving average is also beginning to top out (shed bullish bias).
As a result, a pullback to the 100-hour MA, currently at $10,247 cannot be ruled out.
Disclosure: The author holds no cryptocurrency assets at the time of writing.
Split arrows image via Shutterstock; charts by Trading View

