

- Bitcoin price failed to climb higher and declined sharply below $10,000 against the US Dollar.
- The price is now trading well below the $10,000 level and it could struggle to recover in the near term.
- There was a break below a contracting triangle with support at $10,150 on the hourly chart of the BTC/USD pair (data feed from Kraken).
- The price is under pressure and it is likely to decline further towards the $9,500 support.
Bitcoin price is back in a negative zone below $10,000 against the US Dollar. BTC is facing uphill task and it might face sellers near $9,925 and $10,000.
Bitcoin Price Analysis
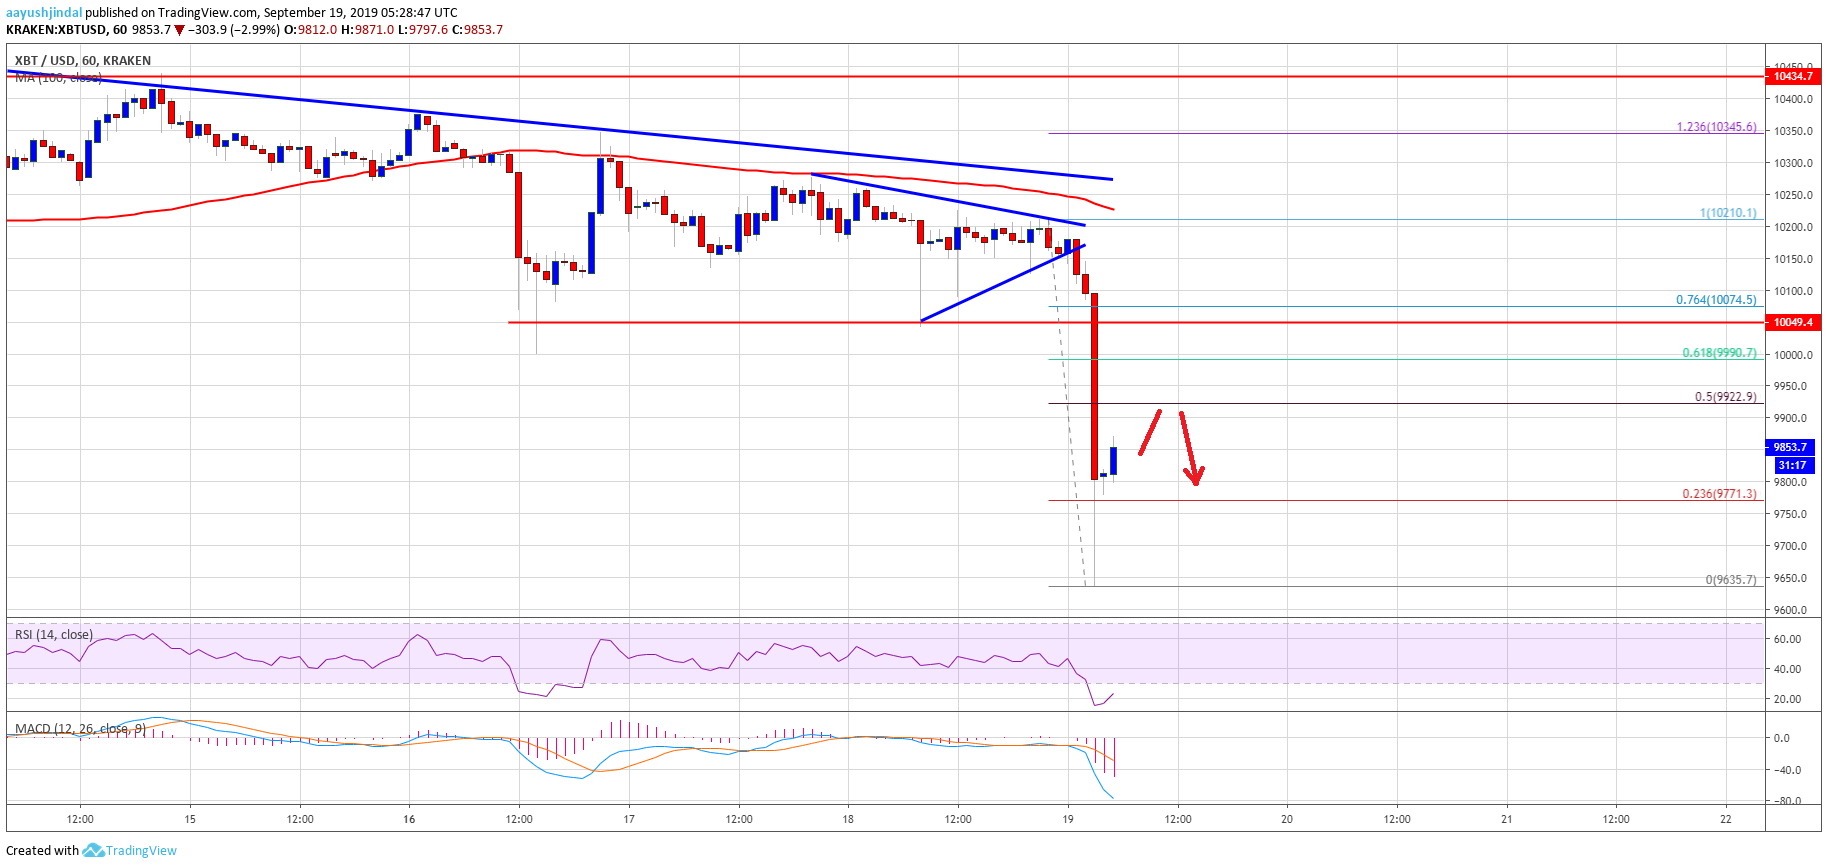
This week, we saw ranging moves in bitcoin below the $10,300 resistance against the US Dollar. BTC struggled to climb higher and recently broke many key supports near the $10,200 and $10,150 levels. Moreover, there was a close below the $10,150 level and the 100 hourly simple moving average. It opened the doors for a sharp decline below the $10,000 support area.
More importantly, there was a break below a contracting triangle with support at $10,150 on the hourly chart of the BTC/USD pair. The pair even broke the $9,900 support area and traded close to the $9,600 level. A swing low was formed near $9,635 and the price is currently correcting higher. It broke the 23.6% Fib retracement level of the recent slide from the $10,210 high to $9,635 low.
An immediate resistance on the upside is near the $9,900 and $9,925 levels. Additionally, the 50% Fib retracement level of the recent slide from the $10,210 high to $9,635 low is near $9,925. However, the main resistance is near the $10,000 and $10,050 levels (the previous support levels). Therefore, an upside correction towards the $10,000 level might face a strong resistance.
On the downside, an immediate support is near the $9,750 level. If there are more downside, the price could even break the recent low at $9,635. The next key support area is near the $9,550 and $9,500 levels, below which the bulls might struggle to protect strong declines.
Looking at the chart, bitcoin price is currently in a bearish zone below the $10,000 level. In the short term, there could be an upside correction, but the $10,000 area could stop the recovery. On the downside, the main supports for the current decline is near the $9,600 and $9,500 levels, where the bulls may take a stand.
Technical indicators:
Hourly MACD – The MACD is currently placed heavily in the bearish zone.
Hourly RSI (Relative Strength Index) – The RSI for BTC/USD is currently correcting higher from the oversold readings.
Major Support Levels – $9,750 followed by $9,600.
Major Resistance Levels – $9,925, $10,000 and $10,200.


