

- Bitcoin price is trading nicely above the $11,650 and $11,500 supports sharply against the US Dollar.
- The price is likely to break the $12,000 resistance and continue higher in the coming sessions.
- There is a crucial contracting triangle forming with resistance near $12,000 on the hourly chart of the BTC/USD pair (data feed from Kraken).
- The price could either rally above $12,000 and $12,200 or it might start a fresh decrease below $11,500.
Bitcoin price is trading with a positive bias above $11,500 against the US Dollar. BTC price is showing positive signs and it could surge above $12,000 and $12,200.
Bitcoin Price Analysis (BTC/USD)
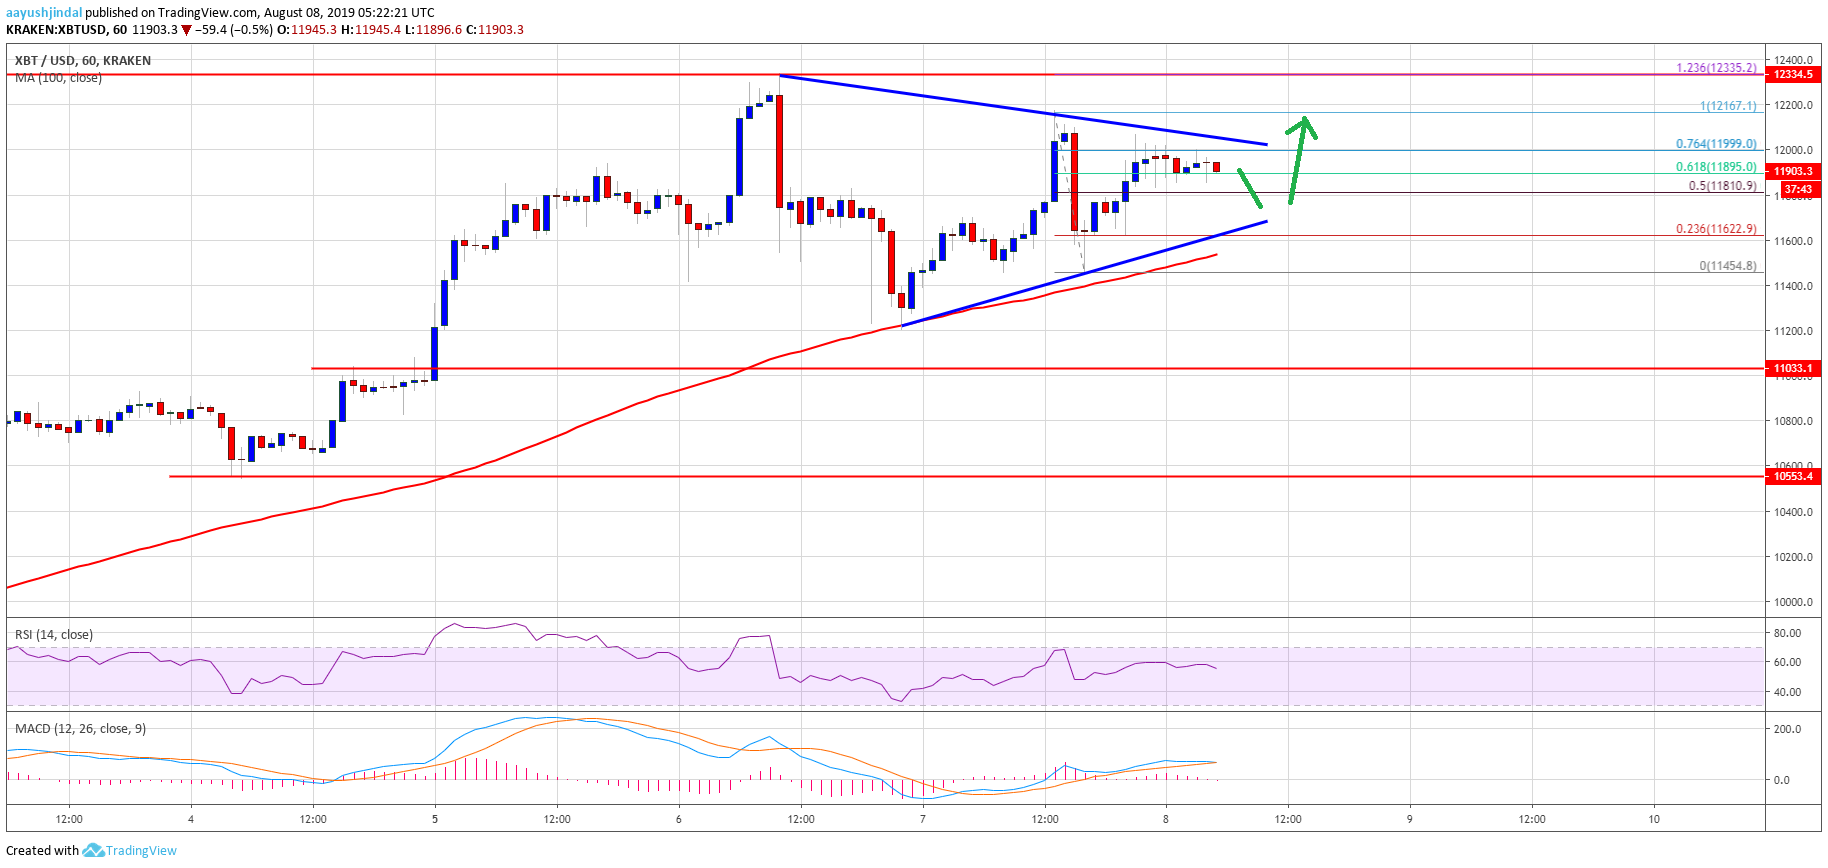
After tagging the $11,200 support, bitcoin price started a decent rise against the US Dollar. The BTC/USD pair climbed higher steadily above the $11,500 and $11,800 resistance levels. Moreover, the pair broke the $12,000 resistance and the 100 hourly simple moving average. However, the price failed to continue above the $12,150 and $12,200 levels. As a result, there was a downside correction below $12,000.
The price traded as low as $11,454 recently and it is currently moving higher. It traded above the $11,650 level plus the 50% Fib retracement level of the recent decline from the $12,167 high to $11,454 low. Moreover, the price broke the $11,800 resistance. However, bitcoin bulls seem to be facing a strong resistance near the $12,000 level. Additionally, the 76.4% Fib retracement level of the recent decline from the $12,167 high to $11,454 low is acting as a resistance.
There is also a crucial contracting triangle forming with resistance near $12,000 on the hourly chart of the BTC/USD pair. Therefore, an upside break above the $12,000 resistance might open the doors for more gains in the near term. The next key resistances are $12,150 and $12,200, above which the price could accelerate above $12,500.
On the other hand, if the price continues to struggle near the $12,000 resistance, there could be a downside reaction. The main support are near $11,650 and $11,500. If there is a break below the $11,500 support, the price could retest the $11,200 support.
Looking at the chart, bitcoin price is trading with a positive bias above the $11,500 and $11,650 level. Having said that, a proper close above the $12,000 level is needed for upside continuation. In the mentioned bullish case, the price could climb towards the $12,500 and $12,850 levels in the near term.
Technical indicators:
Hourly MACD – The MACD is currently losing momentum in the bullish zone.
Hourly RSI (Relative Strength Index) – The RSI for BTC/USD is currently correcting lower towards the 50 level.
Major Support Levels – $11,650 followed by $11,500.
Major Resistance Levels – $12,000, $12,150 and $12,200.


