Bitcoin price on Tuesday was looking to correct lower after forming a Doji candlestick. But the US session somewhat saved the day.
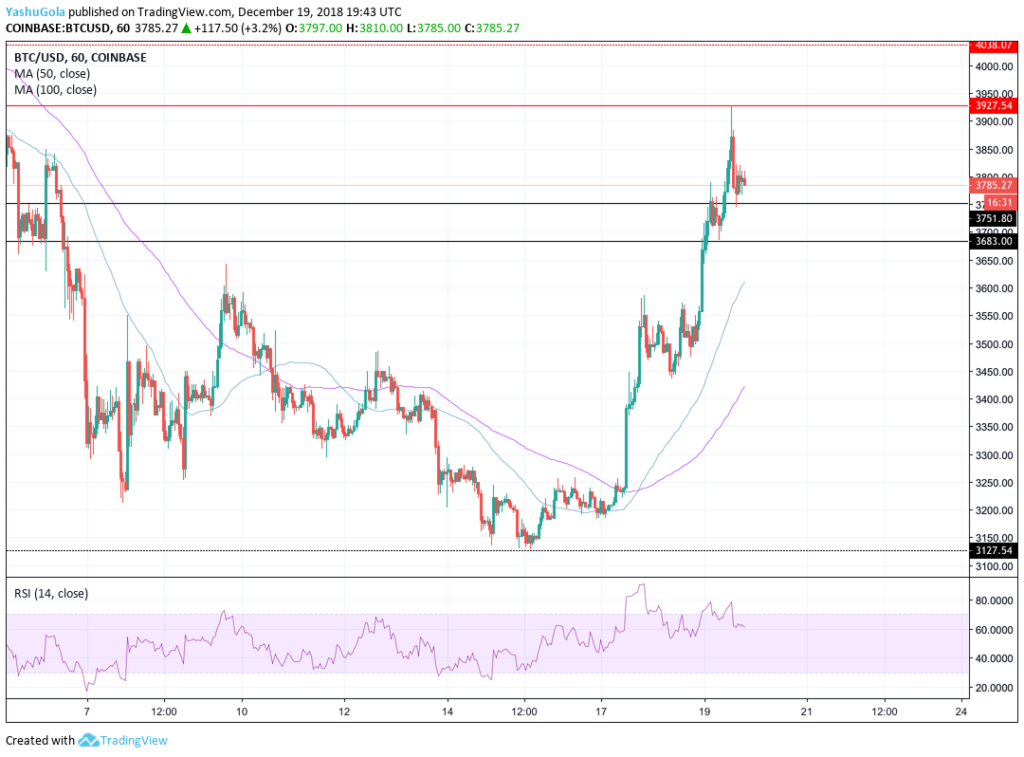
The Bitcoin/Dollar rate on Wednesday has extended its upside momentum, rising circa 8% on a 24-hour timeframe, according to CoinMarketCap.com. The pair today established a fresh intraday high towards 3927-fiat on Coinbase during the mid-European session after finding more firm support in 3450-3500 area. Reminding that it isn’t exactly a dream bull run yet – not unless bitcoin price surpasses key resistance areas lurking at its 50-period and 100-period moving average resistances on a daily chart.
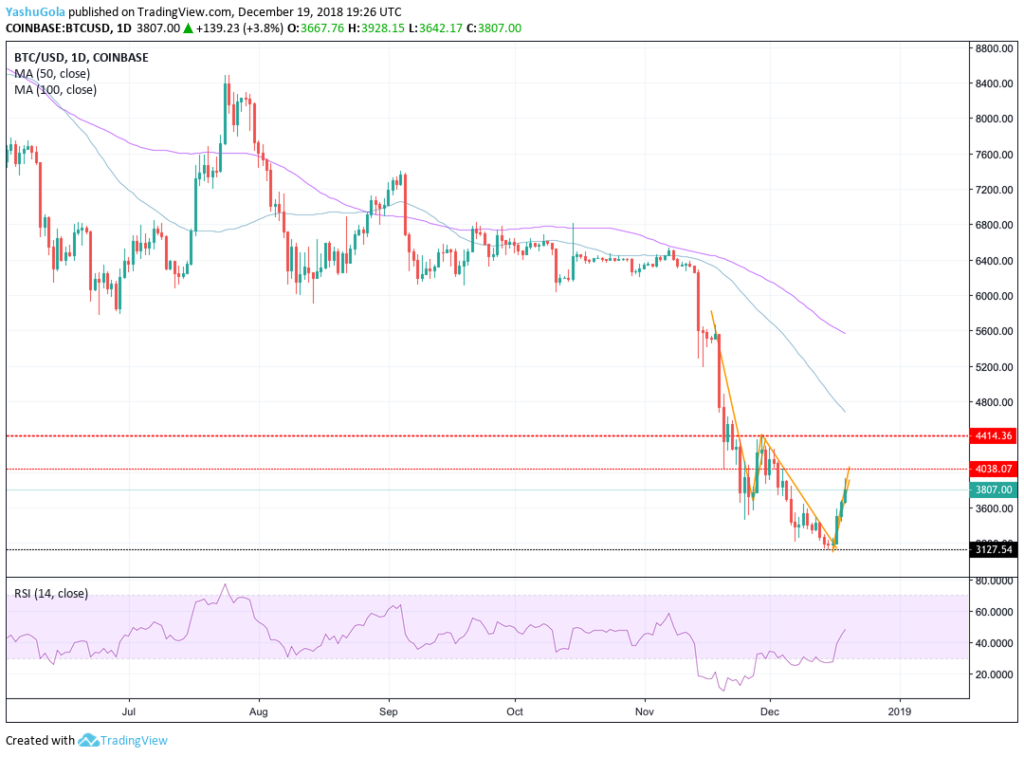
The Bitcoin/Dollar price upside action reignited during a US session that somewhat drags the performance of the US Dollar into the picture. The greenback fell against its significant quoted assets on Wednesday in another response to the Fed’s slower pace of interest rate hikes. We have previously predicted that a sluggish interest rate hike could be useful for stocks and gold markets, hinting that cryptocurrencies like bitcoin could also witness dollar holders moving their positions into its “safe haven”.
Bitcoin/USD in Bear Flag
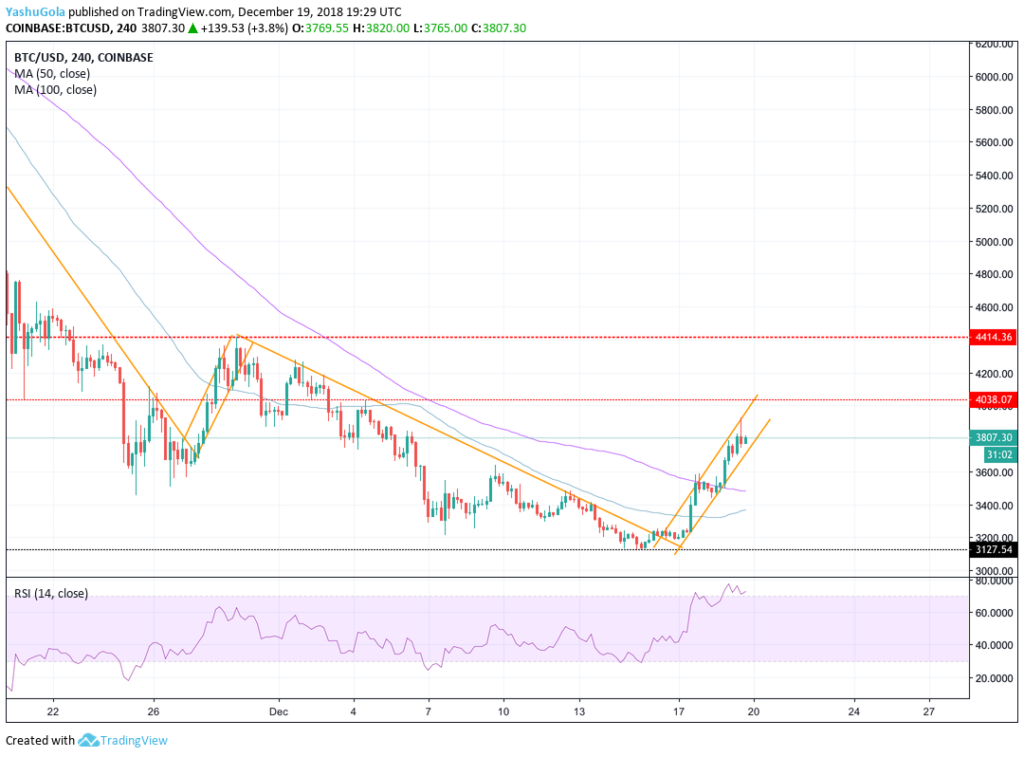
The Bitcoin/Dollar rate is trending inside a bear flag while eyeing a potential inverse head and shoulder breakout. We have two possibilities as the pair trends ahead. The first one is a reversal that could see the pair test support near the 100-period moving average or form a double bottom at 3127-fiat in an extended selling action. The second possibility is an extended upside run towards 4414-fiat upon breaking the intermediate resistance at 4038-fiat. The latter would establish an inverse H&S while a breakout above 4414-fiat will fix the next target at 4750-fiat or less.
The Relative Strength Index, meanwhile, is looking to rebound from its overbought area towards 63, its previous support.
Bitcoin/USD Intraday Analysis
The Long and Long of It
According to our intraday strategy, the parameter we are in is defined by 3751-fiat as support and 3927-fiat as resistance. On a first green candle formation on hourly charts, we will open a long position towards 3927-fiat. As we do, we’ll maintain a stop loss order just 1-pip below our opening position.
Similarly, a selling action at this point in time would have us wait for Bitcoin/Dollar to test 3751-fiat as potential support. If the price bounces back, then we’ll repeat our long position strategy towards 3927-fiat. If not, we’ll switch to our breakdown strategy and open a new short position towards 3683-fiat, our interim downside target.
Looking to the upside, a breakout action above 3927-fiat will have us enter a long position towards 4038-fiat. A stop-loss maintained just 1-pips below the entry position would define our risk management strategy.
Trade safe!
View the live bitcoin price chart on CCN here.
Featured image from Shutterstock.
Get Exclusive Crypto Analysis by Professional Traders and Investors on Hacked.com. Sign up now and get the first month for free. Click here.

