
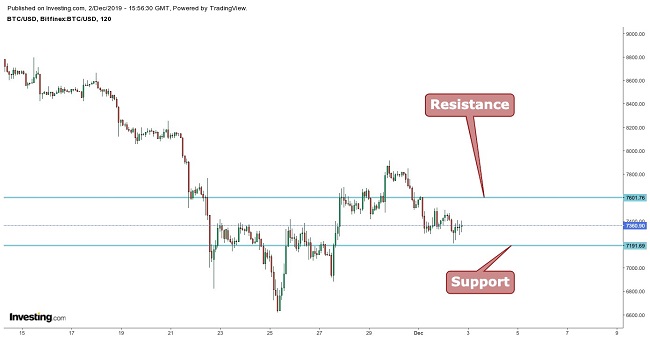
When looking at the chart below we can see that Bitcoin(BTC)trade is trading at $7,300. The largest cryptocurrency by market capitalization is trading witin the channel with $7,600 acting as resistance and as the channel upper limit, and $7,190 is acting as support and as the channel lower limit.
The lower limit is confirmed by the formation of a morning star pattern and the upper limit is confirmed by the formation of a piercing pattern.
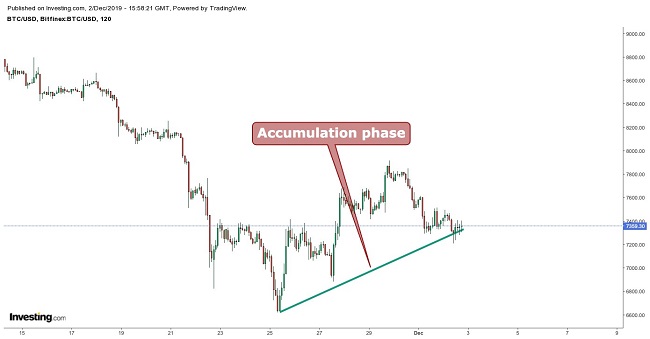
Dow Theory
The Bitcoin price is currently appearing in the accumulation phase. This is the phase when informed and savvy investors are actively buying digital currency against the general opinion of the crypto market. During this phase, the BTC price does not change much because these investors are in the minority demanding supply that can be easily provided.
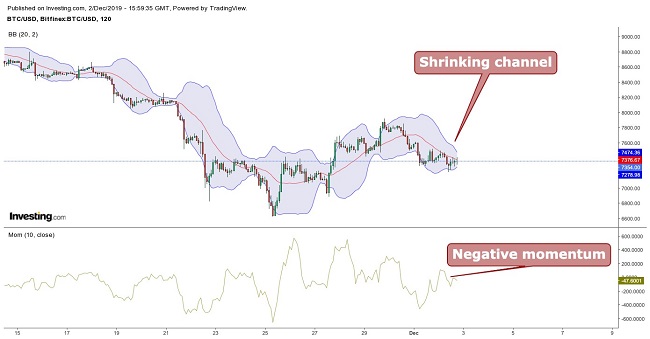
Bollinger Bands
The BTC price is moving between the channels with the middle average line acting as resistance and the lower limit acting as support. It can be observed that the channel is shrinking with a negative momentum, which indicates decreased volatility with downtrend sentiment.
Therefore, some correction is expected, and taking long positions is not suggested. Also, it shows indecision so the price is expected to keep on trading inside the channel at least in the short term.
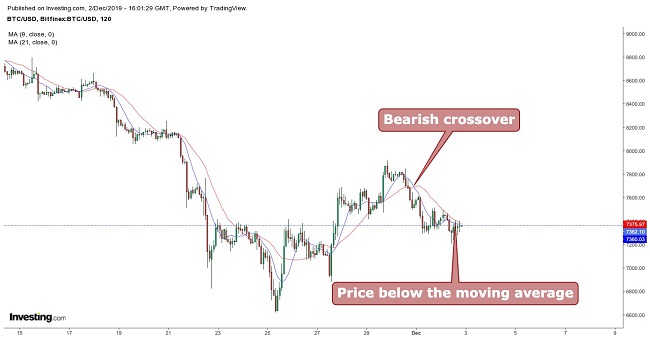
Moving Average
When taking 9 period moving averages (blue) with 21 period moving averages (red), a bearish crossover is seen whilst the cryptocurrency price is trading below the 9 and 21 period moving averages.
This indicates a negative trend. It is suggested to wait until Bitcoin’s price starts trading above the moving average.
Conclusion
Bitcoin(BTC)trade is currently trading at $7,300. $7,600 is acting as resistance and $7,190 is acting as support. When looking at all the indicators it is suggested not take long positions at this present price as it is expected to trade within the channel. Swing trading can be done using the above mentioned levels.
There is no indication for a positive breakout. A close below $7,100 can drag the price down to the $6,800 levels. A close above $7,600 can take the price up to $7,800.
Pivot Points
| Name | S3 | S2 | S1 | Pivot Points | R1 | R2 | R3 |
| Classic | 5543.8 | 6081.6 | 6840.7 | 7378.5 | 8137.6 | 8675.4 | 9434.5 |
| Fibonacci | 6081.6 | 6577.0 | 6883.1 | 7378.5 | 7873.9 | 8180.0 | 8675.4 |
| Camarilla | 7243.2 | 7362.1 | 7481.0 | 7378.5 | 7718.8 | 7837.6 | 7956.5 |
| Woodie’s | 5654.6 | 6137.0 | 6951.5 | 7433.9 | 8248.4 | 8730.8 | 9545.3 |
Technical Indicators
| Name | Value | Action |
| RSI(14) | 42.082 | Sell |
| STOCH(9,6) | 38.658 | Sell |
| STOCHRSI(14) | 2.536 | Oversold |
| MACD(12,26) | 77.400 | Buy |
| ADX(14) | 33.886 | Sell |
| Williams %R | -82.653 | Oversold |
| CCI(14) | -123.3429 | Sell |
| ATR(14) | 1205.9060 | Less Volatility |
| Highs/Lows(14) | -801.8042 | Sell |
| Ultimate Oscillator | 45.408 | Sell |
| ROC | -23.444 | Sell |
| Bull/Bear Power(13) | -2309.6240 | Sell |