

Bitcoin broke the key $40,000 resistance zone against the US Dollar. BTC is up over 12% and might continue to rise above the $43,000 level.
- Bitcoin surged above a few key hurdles near the $40,000 resistance zone.
- The price is trading above $42,000 and the 100 hourly simple moving average.
- There was a break above a key bearish trend line with resistance near $38,000 on the hourly chart of the BTC/USD pair (data feed from Kraken).
- The pair has moved into a bullish zone and might accelerate higher towards $45,000.
Bitcoin Price Surges
Bitcoin price remained in a positive zone above the $38,00- pivot level. BTC was able to start a major increase after it cleared the $38,800 resistance zone.
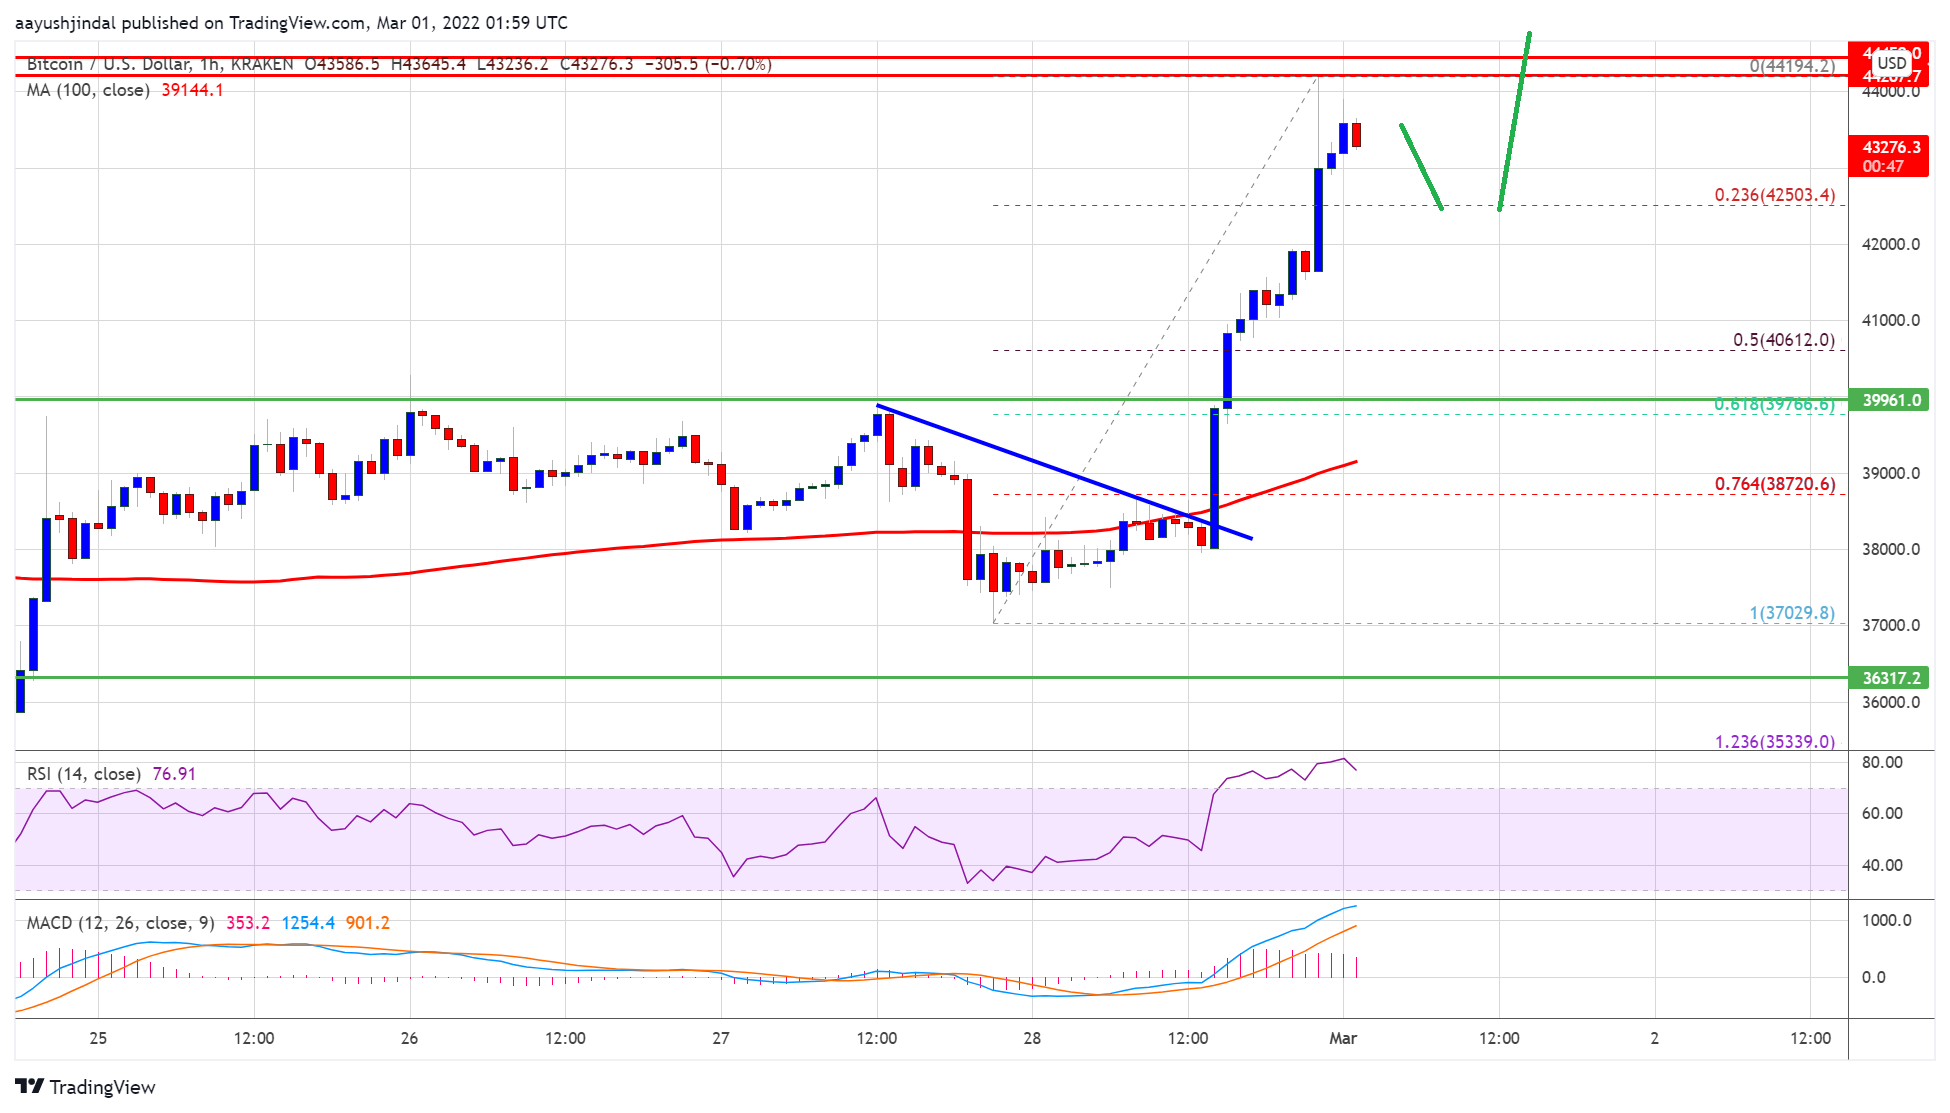
There was a break above a key bearish trend line with resistance near $38,000 on the hourly chart of the BTC/USD pair. It opened the doors for a sharp increase above the $40,000 resistance and the 100 hourly simple moving average.
The price rallied over 10% and there was a clear move above the $42,000 resistance zone. It even cleared the $43,000 level and traded as high as $44,192.
Bitcoin is now consolidating and trading well above the 23.6% Fib retracement level of the upward move from the $37,029 swing low to $44,192 high. On the upside, an immediate resistance is near the $44,000 level. The first key resistance is near the $44,200 level.
Source: BTCUSD on TradingView.com
The main resistance is now near the $44,500 level. A clear move above the $44,500 resistance could send the price further higher. In the stated case, it could even attempt a clear move above $45,000.
Dips Limited in BTC?
If bitcoin fails to clear the $44,200 resistance zone, it could start a downside correction. An immediate support on the downside is near the $43,000 zone.
The next major support is seen near the $42,500 level. If there is a downside break below the $42,500 support, the price might gain bearish momentum towards $40,500. It is near the 50% Fib retracement level of the upward move from the $37,029 swing low to $44,192 high.
Technical indicators:
Hourly MACD – The MACD is now losing pace in the bullish zone.
Hourly RSI (Relative Strength Index) – The RSI for BTC/USD is correcting from the overbought zone.
Major Support Levels – $43,000, followed by $42,500.
Major Resistance Levels – $44,000, $44,200 and $45,000.


