

Bitcoin declined sharply below the $6,200 support against the US Dollar. BTC price found support near $5,850 and it is currently recovering towards a couple of key hurdles.
- Bitcoin is correcting higher from the $5,846 swing low against the US Dollar.
- The price is showing positive signs above the $6,000 level, but there are many hurdles on the upside.
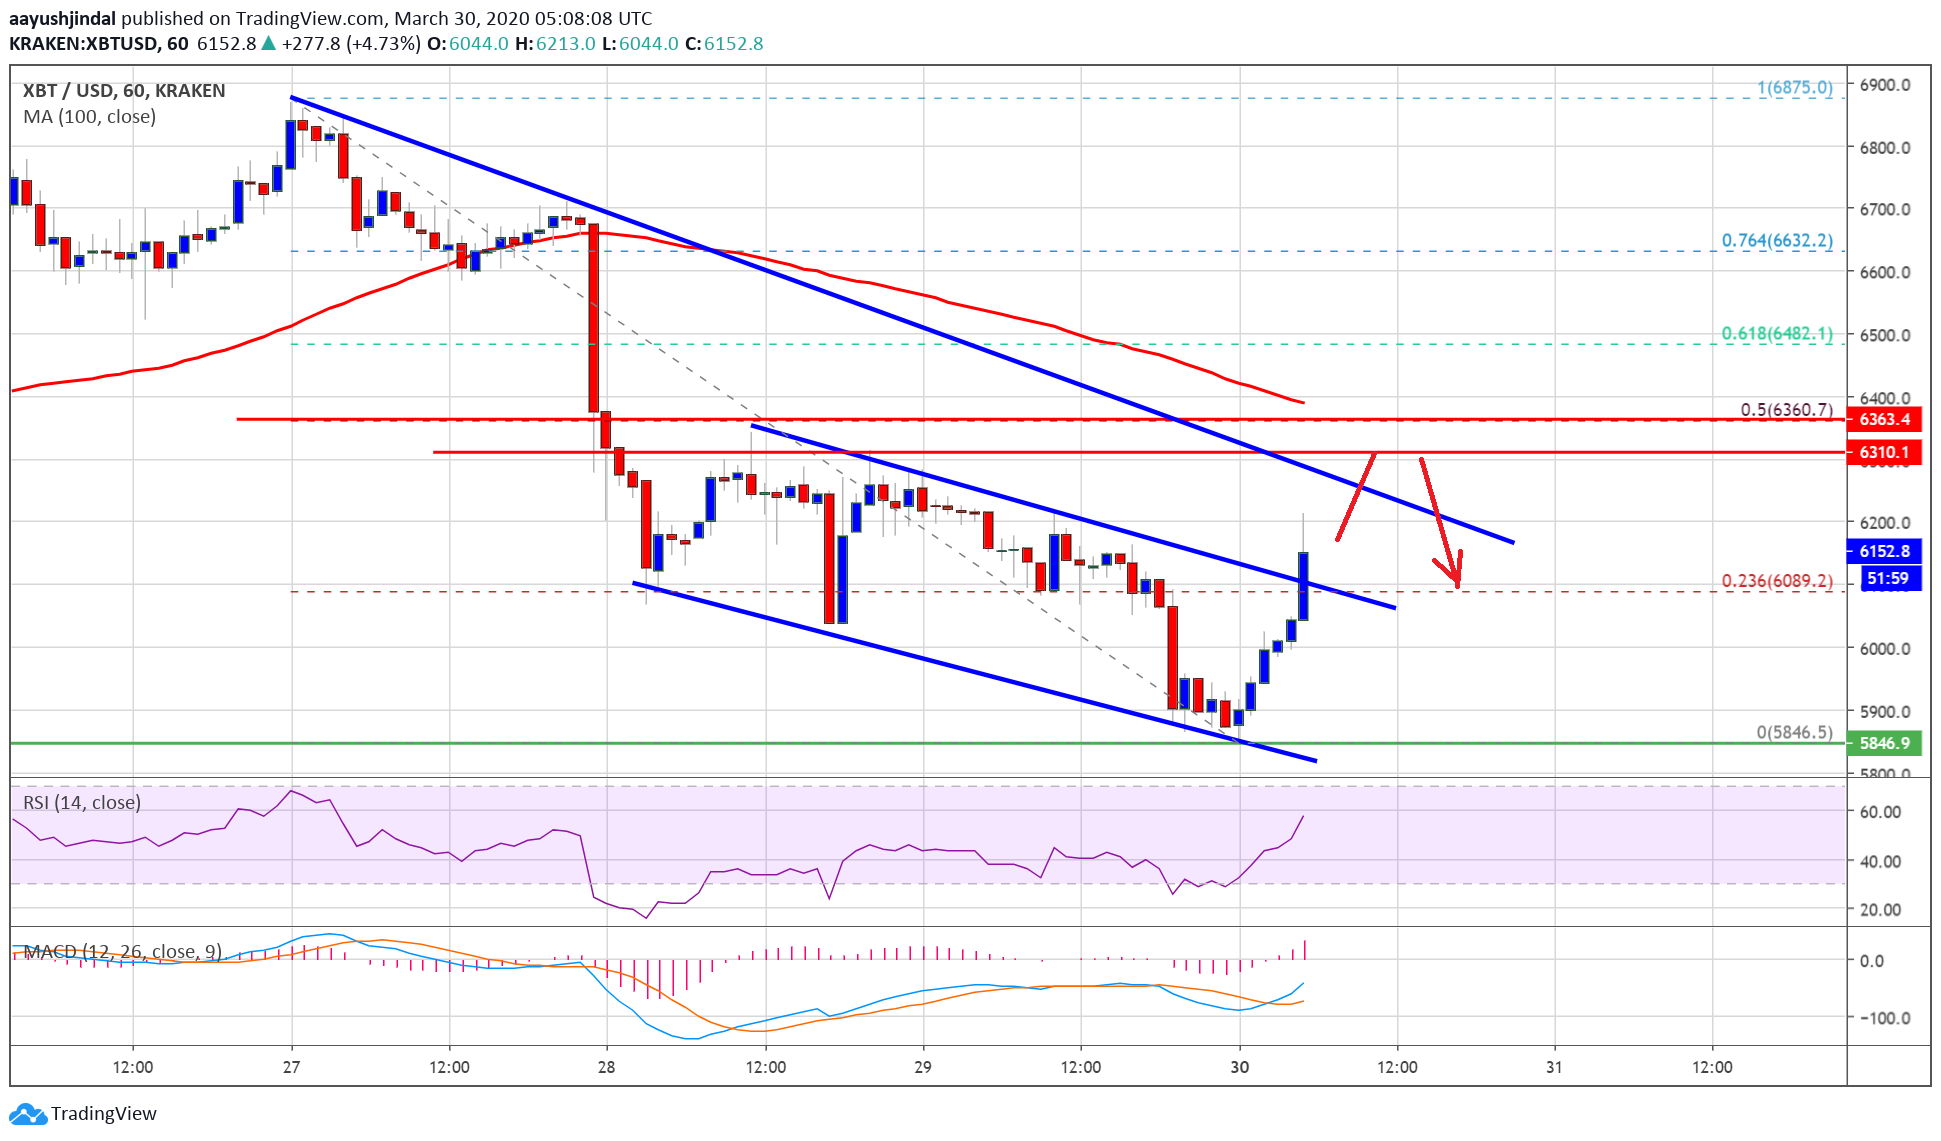
- There was a break above a key declining channel with resistance near $6,080 on the hourly chart of the BTC/USD pair (data feed from Kraken).
- The pair is likely to face a strong resistance near the $6,300 and $6,350 resistance levels.
Bitcoin Correcting Losses
Recently, there was a steady decline in bitcoin from well above the $6,500 support against the US Dollar. BTC price even broke the key $6,200 support area and the 100 hourly simple moving average.
The bears were able to push the price below the $6,000 support area. The price traded as low as $6,846 and it is currently correcting higher. There was a strong recovery wave above the $5,950 and $6,000 levels.
Bitcoin surpassed the 23.6% Fib retracement level of the downward move from the $6,875 high to $5,846 low. Moreover, there was a break above a key declining channel with resistance near $6,080 on the hourly chart of the BTC/USD pair.
The pair is now trading near the $6,200 resistance area (the previous support). On the upside, there are many key hurdles, starting with $6,300. The main resistance is near the $6,350 level and the 100 hourly simple moving average.
The 50% Fib retracement level of the downward move from the $6,875 high to $5,846 low is also near the $6,360 level to act as a key hurdle for the bulls.
If the bulls gain pace above the $6,300 and $6,350 resistance levels, there are chances of a steady rise in the coming sessions. The next major resistance is near the $6,500 and $6,650 levels.
Limited Recovery
If bitcoin fails to continue above the $6,200 and $6,300 resistance levels, it could start a fresh decline. An initial support on the downside is near the $6,000 and $5,950 levels.
The main support is now near the $5,850 level, below which there is a risk of a larger decline in the coming sessions.
Technical indicators:
Hourly MACD – The MACD is currently gaining momentum in the bullish zone.
Hourly RSI (Relative Strength Index) – The RSI for BTC/USD is rising and it is back above the 50 level.
Major Support Levels – $6,000 followed by $5,950.
Major Resistance Levels – $6,200, $6,300 and $6,350.
Take advantage of the trading opportunities with Plus500
Risk disclaimer: 76.4% of retail CFD accounts lose money.

