
View
- Bitcoin is again closing on the 200-week moving average, which served as strong support in December. The weekly RSI is more bearish this time round, though, and is reporting undersold conditions.
- A weekly close below that level could be followed by a slide back to September 2017 lows near $2,970.
- A failure to push prices below the 200-week SMA support would weaken the bears. A bullish reversal, however, would be confirmed only above $3,658 – the high of gravestone doji carved out Saturday.
Bitcoin (BTC) is on the defensive after a drop to six-week lows and could soon test crucial long-term support below $3,300.
The cryptocurrency fell to $3,322 – the lowest level since Dec. 17 earlier today – bolstering the bearish view put forward by Monday’s high-volume range breakdown. Trading volumes jumped to 18-day highs near $7 billion yesterday, according to CoinMarketCap data.
The high-volume sell-off has likely opened the doors to re-test of December lows near $3,100.
Moreover, the long-term support level put the brakes on a sell-off back in December, and was followed by a corrective bounce to levels above $4,000.
A strong bounce from the 200-week SMA line would likely embolden the bulls, but the probability of a bull reversal from that SMA support looks low, according to technical indicators.
As of writing, BTC is trading at $3,380 on Bitstamp, representing a 1.5 percent drop on a 24-hour basis.
Weekly chart
As seen above, BTC is again trading within striking distance of the 200-week SMA of $3,298.
The support had held ground on a weekly closing basis (Sunday, UTC) in mid-December, possibly because the relative strength index (RSI) was reporting oversold conditions at the time. This time, however, the SMA support could be breached, as the RSI is currently in undersold territory.
Daily chart
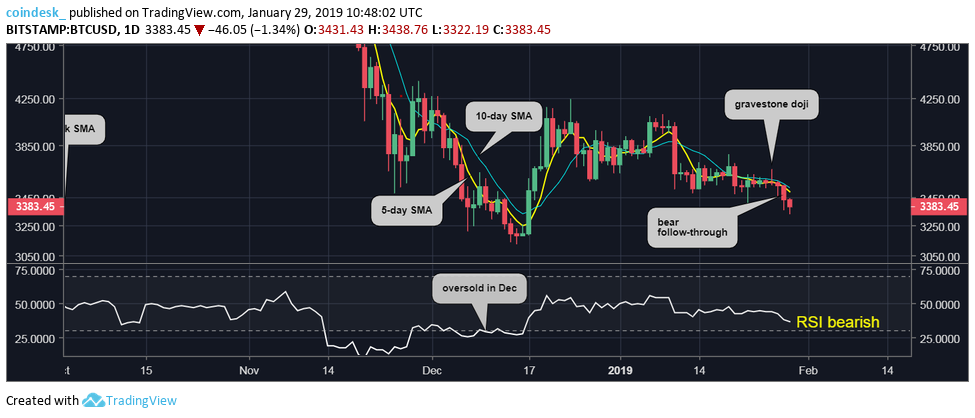
The RSI on the daily chart is also biased toward the bears, as opposed to the record oversold conditions seen in November and December. The 5- and 10-day moving averages (MAs) are also trending south, indicating a bearish setup.
Hence, a drop to the December low of $3,122 could be on the cards.
4-hour and hourly chart
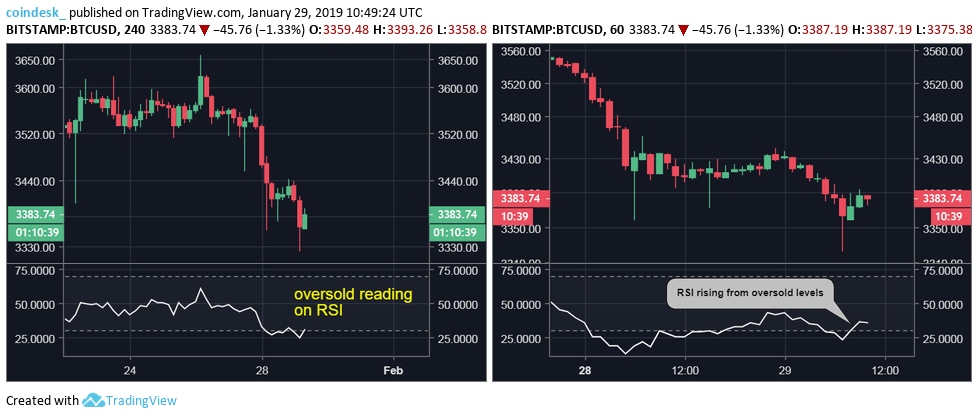
The RSIs on the 4-hour and hourly charts are reporting oversold conditions below 30.00. Therefore, a convincing break below the 200-week SMA of $3,298 could be preceded by a minor bounce.
Disclosure: The author holds no cryptocurrency at the time of writing.
Bitcoin image via CoinDesk archives; charts by Trading View