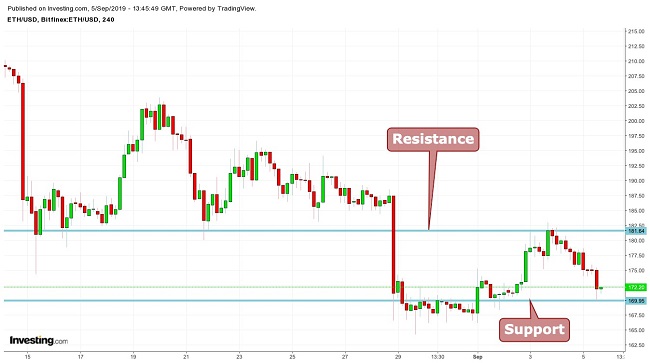
Ethereum (ETH)trade is currently trading at $172.50. As you can see in the graph below, the ETH price is trading between the channels. The next resistance level is at $182 and support level is at $170.
Long positions can be taken around the first support level, keeping the it as a stoploss. The cryptocurrency price is expected to trade between the channels for two cycles, and this can be used for swing trading.
Dow Theory
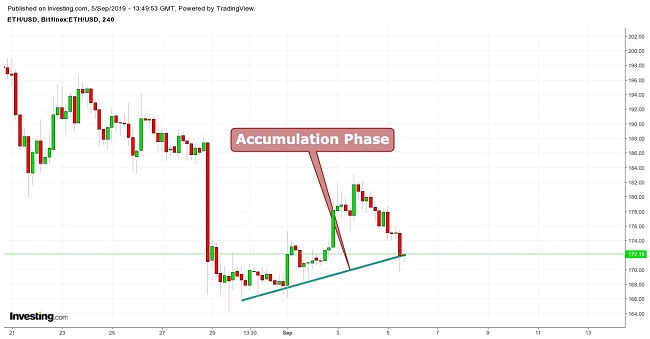
According to Dow Theory, the digital coin is currently appearing in the accumulation phase, which is an area from which the price usually shoots up, and is generally considered a great buying point.

This is the time when informed investors (experienced traders and institutions) are usually entering their long positions in the market. The price movements during the accumulation phase are tradtionally slow. The accumulation phase often falls into the end of a downtrend.
Bollinger Bands
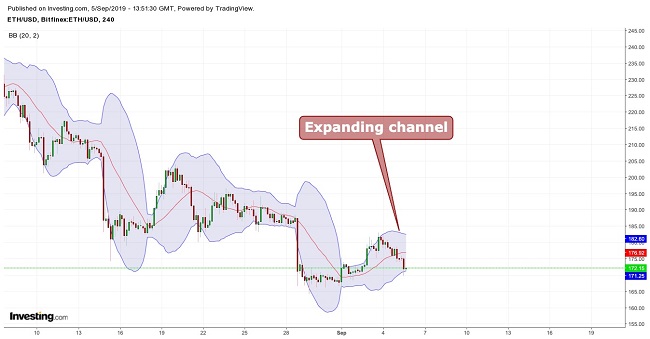
Ethereum’s price is moving between the channels as can be seen below. The channel is expanding, indicating an increased price volatility and therefore long positions can be taken, keeping the lower limit as support.
Moving Average
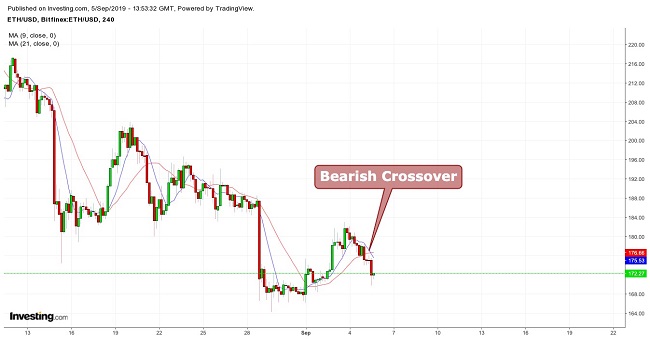
When taking 9 period moving averages (blue) with 21 period moving averages (red), a bearish crossover can be seen. Also, the price is moving below the moving average, indicating a downward movement. It is suggested to take long positions once the ETH price is above the moving averages.
Conclusion
Ethereum (ETH)trade is currently trading at $172.50, and as you can see above, the price is trading between the channels. The resistance level is at $182 and support at $170. Risk avoiders can take long positions once the ETH price is above the moving averages.
Swing trading can be done using the aforementioned levels. The mid-term trend looks bullish. If the price closes above $182 it can touch the $195 levels. A close below $170 can drag the price down to $154.
Pivot Points
| Name | S3 | S2 | S1 | Pivot Points | R1 | R2 | R3 |
| Classic | 129.56 | 146.87 | 159.50 | 176.82 | 189.45 | 206.77 | 219.40 |
| Fibonacci | 146.87 | 158.31 | 165.38 | 176.82 | 188.26 | 195.33 | 206.77 |
| Camarilla | 163.90 | 166.64 | 169.39 | 176.82 | 174.87 | 177.62 | 180.36 |
| Woodie’s | 127.22 | 145.70 | 157.16 | 175.65 | 187.11 | 205.60 | 217.06 |
Technical Indicators
| Name | Value | Action |
| RSI(14) | 41.552 | Sell |
| STOCH(9,6) | 14.141 | Oversold |
| STOCHRSI(14) | 0.000 | Oversold |
| MACD(12,26) | -1.970 | Sell |
| ADX(14) | 34.682 | Sell |
| Williams %R | -96.075 | Oversold |
| CCI(14) | -110.6007 | Sell |
| ATR(14) | 43.7562 | Less Volatility |
| Highs/Lows(14) | -43.3891 | Sell |
| Ultimate Oscillator | 38.490 | Sell |
| ROC | -34.943 | Sell |
| Bull/Bear Power(13) | -61.4000 | Sell |

If You Liked This Article Click To Share