

By CCN Markets: On May 21, a pseudonymous cryptocurrency technical analyst named “Rampage” posted on Twitter that ETH/BTC is about ready to catch up to ETH/USD. In a tweet, the attached an image in which the price action of two markets is overlaid in a single chart.
The analyst predicts that Ethereum will move higher against bitcoin and follow the price action of its USD counterpart:
Looks like it’s time for $ETH| $BTC to catch up to $ETH| $USD pic.twitter.com/3KDafuWYCG
— 𝓡𝓪𝓶𝓹𝓪𝓰𝓮 🦍 (@Thrillmex) May 21, 2019
We’re covering this particular tweet because of a compelling technical analysis on why Ethereum is bullish against bitcoin. Within the same tweet, the person behind the account created a thread to support the forecast.
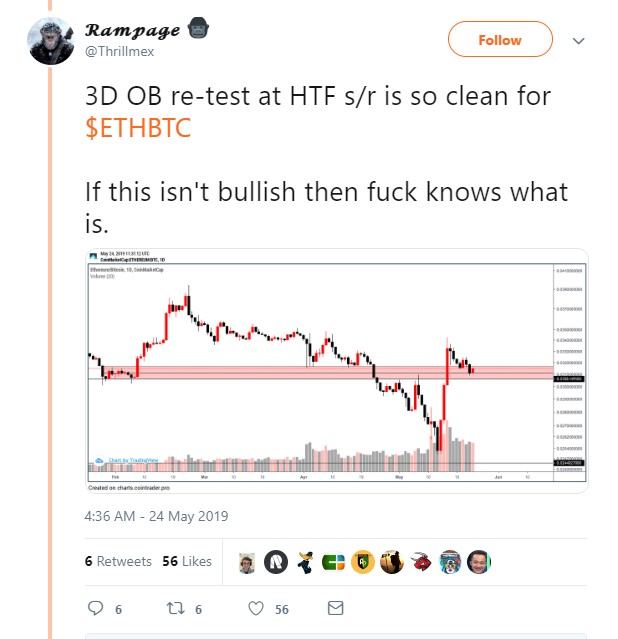
For instance, on May 24, the analyst emphasized how Ethereum converted the former resistance of 0.03 into support. In our book, that’s seemingly bullish price action as it shows rejection of lower prices.
Here is an illustration of Ethereum flipping a key resistance area into support:
Zoomed in because you can’t actually see the stop on previous post.
Decisive close under this swing low + HTF s/r flip and i’m out.
If I’m looking for a low risk high reward play, this is what it looks like. $ETHBTC pic.twitter.com/aLzLrUFgC4
— 𝓡𝓪𝓶𝓹𝓪𝓰𝓮 🦍 (@Thrillmex) May 24, 2019
Longer Timeframe Ethereum Analysis
The analysis also points to an ultra bullish take on a longer time frame. Based on the tweet, the resistance into support (S/R) flip and the retest of the three-day order block (OB) looks clean on the longer timeframe. In technical analysis jargon, order block is another term for a support or demand area.
Ethereum holding a key level on the three-day chart:
Ethereum holding a key level on the three-day chart | Source: Twitter
With the cryptocurrency flashing bullish signals, Rampage posted a chart where the targets are specified. The first target is 0.040873 and the second target is 0.053449. Ethereum is trading at 0.030858 as of press time. If the analysis turns out to be accurate, long postitions in the market can potentially boost Ethereum holdings against bitcoin by over 70 percent.
Ethereum price targets against bitcoin:
Clean long setup on $ETHBTC pic.twitter.com/W3oNfTUIWD
— 𝓡𝓪𝓶𝓹𝓪𝓰𝓮 🦍 (@Thrillmex) May 24, 2019
It has been three weeks since the prediction was made, and Ethereum has yet to make its move. However, bulls have a legitimate chance in the next 24 to 48 hours to finally make their presence felt. The key level to take out is the resistance between 0.031 and 0.032.
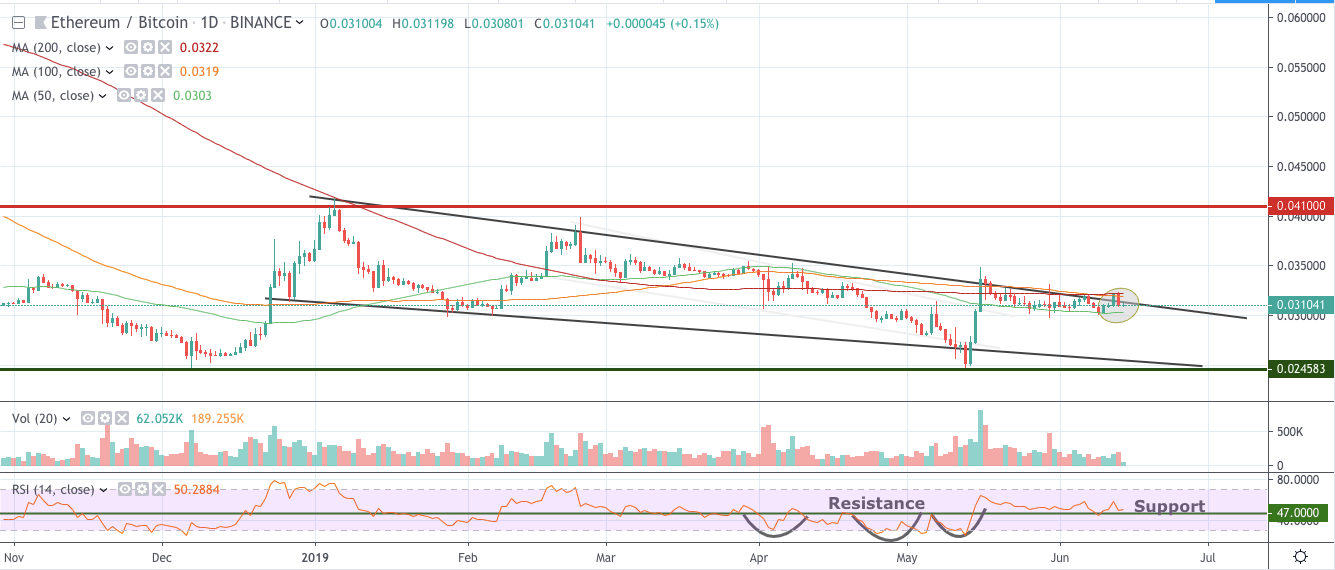
Bulls are working hard to finally take out the diagonal resistance | Source: TradingView
A look at the daily chart shows that the cryptocurrency is painting a large falling wedge. This is regarded as a bullish pattern. The breach of the diagonal resistance should start the fireworks for Ethereum.
The good news is that bulls are in the perfect position to break out of the pattern. They have been threatening to take out the diagonal resistance for almost a month now. During that period, the daily RSI has gone bullish. It broke out of a triple bottom pattern when it converted resistance of 47 into support. This is a very good signal indicating that the market is gaining significant bullish momentum. All of which supports the analyst’s forecast and price targets.
So far, we have a confluence of several events that support the analyst’s forecast. First, we have a clean support into resistance flip (S/R) in both the shorter and longer timeframes. In addition, bulls look ready to break out of a falling wedge on the daily chart. The bullish momentum gained as seen on the daily RSI will likely give the bulls the push they need to go over the edge.
With these factors, we may very likely see Ethereum trading at 0.040873 and then 0.053449 in the coming weeks.
Click here for a real-time Ethereum price chart.
Disclaimer: The views expressed in the article are solely those of the author and do not represent those of, nor should they be attributed to, CCN Markets.


