After Bitcoin (BTC) price flirted with a $42,000 all-time high on Jan. 8, it stabilized in a tightening range between $39,000 to $41,500 for two days and the pennant structure on the shorter-term timeframes hinted that a breakout to $45,000 was a possibility.
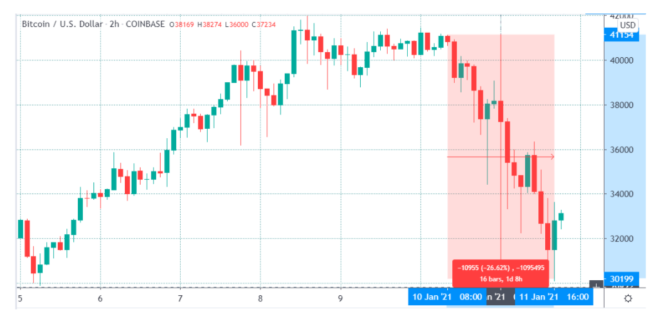
This all changed quite suddenly Jan. 10 as the $39,000 support failed to hold and Bitcoin price entered a steep correction.
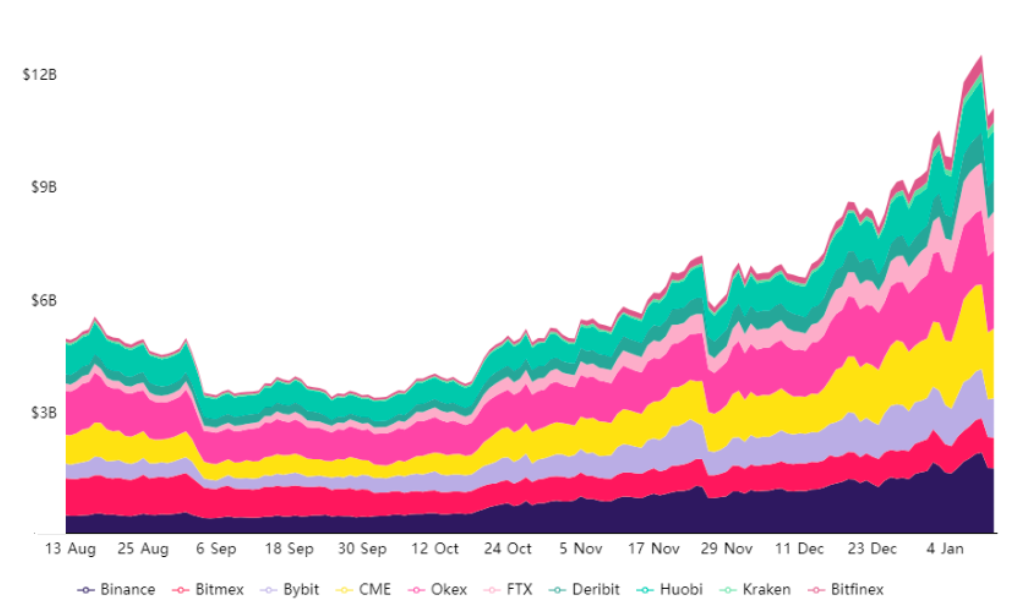
A swirling and cruel 26.6% drop took BTC down to $30,100 over the next 30 hours and $1.5 billion in cascading liquidations at derivatives exchanges boosted the correction. Interestingly, this occurred just as the open interest on BTC futures reached a $12.7 billion all-time high.
Today’s price action presents a story of doom, gloom and liquidations, but what it fails to mention is that the Bitcoin price crashed by 20.4% just one week ago as it tested sub $28,000 levels.
During that similar price event, a total of $1.2 billion in long contracts were liquidated, so the price action of today isn’t so different from what the market experienced just a week ago on Jan. 11.
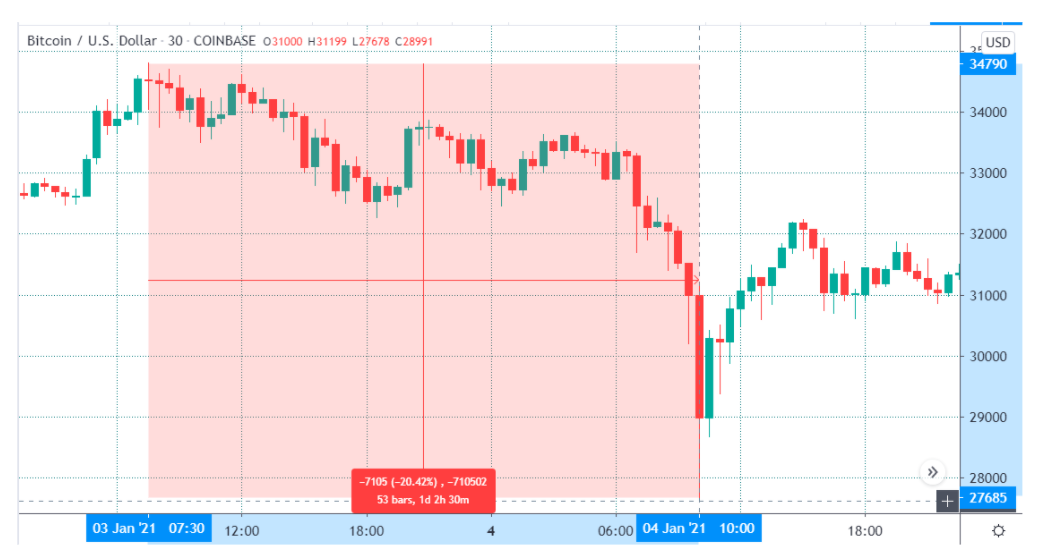
As the chart above shows, BTC bounced back by 11% one hour after dropping below the $28,000 level. What might have surprised traders this time around is the 13% bounce from $32,200 to $36,400 which created a false bottom.
To understand if that’s the case, one should analyze crypto exchanges’ top traders long-to-short ratio and hourly liquidations.
OKEx top traders bought the top
Exchange-provided data highlights traders’ long-to-short net positioning. By analyzing every client’s position on the spot, perpetual and futures contracts, one can obtain a clearer view of whether professional traders are leaning bullish or bearish.
With this said, there are occasional discrepancies in the methodologies between different exchanges, so viewers should monitor changes instead of absolute figures.
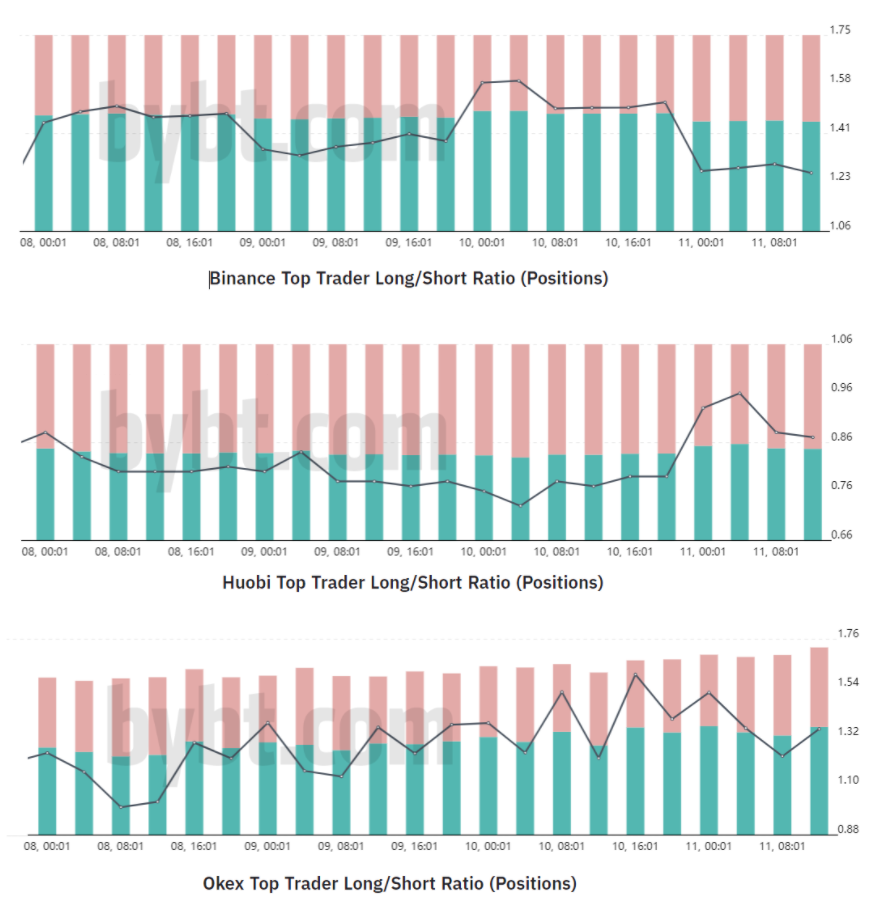
The top traders at Binance averaged a 23% position that favored longs over the past 30 days. This wasn’t the case on Jan. 7, when they started adding long positions until reaching a 59% peak in the early hours of Jan. 10.
This move took place as BTC broke the $37,000 resistance and paved its way to $41,500. Therefore, Binance top traders have been mostly reacting after each BTC price move instead of trying to anticipate it.
On the other hand, top traders at Huobi averaged a 0.91 long-to-short ratio over the last 30 days, thus favoring net shorts by 9%. From Jan. 8 to the early hours of Jan. 10, these traders had been increasing their shorts, hence profit-taking as BTC failed to break the $42,000 level.
This trend reverted as BTC lost the $39,000 support, and Huobi’s top traders reduced their 28% net short to 4% in an attempt to catch the bottom.
Lastly, OKEx top traders have been adding long positions, driving the indicator from 1.00 (flat) in the early hours of Jan. 8 to a 1.79 ratio favoring longs in the early hours of Jan. 11.
These traders bought the top and were the ones who were heavily liquidated as the BTC price crashed by 26%. Their long to short ratio hit 1.00 (flat) again just as BTC hit $34,000 on Jan. 11.
Bitfinex traders were also caught by surprise
Bitfinex gathers weekly data on top traders’ profit and loss, although it is possible for users to ‘opt-out’ from this ranking. Over the past 24 hours, the bottom 10 lost a combined $153.3 million.
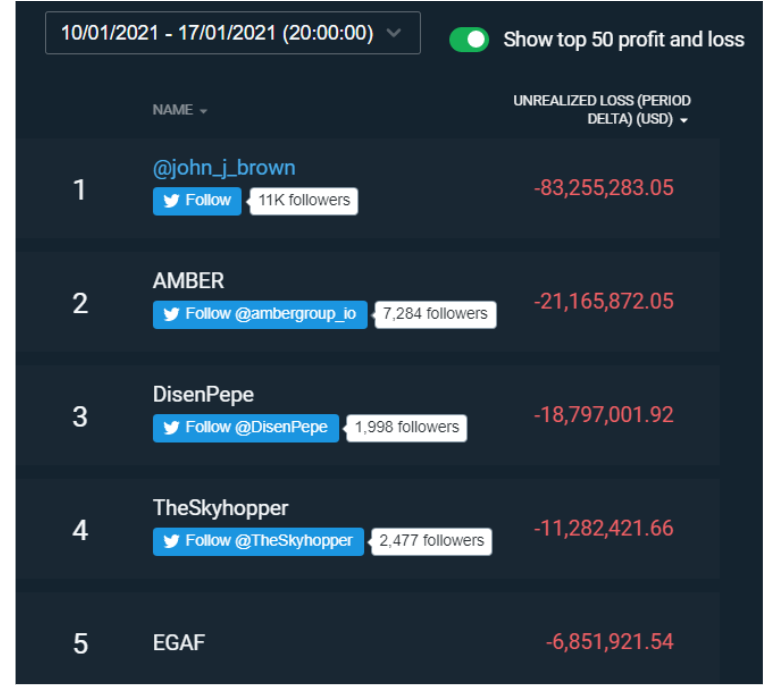
Relevant losses during a surprise crash should not mean that Bitfinex traders got it all wrong. Some traders might have been ill-positioned, but overall they have been profit-taking during the rally. As of now, Bitfinex traders are back to a ‘neutral’ position according to its historical levels.
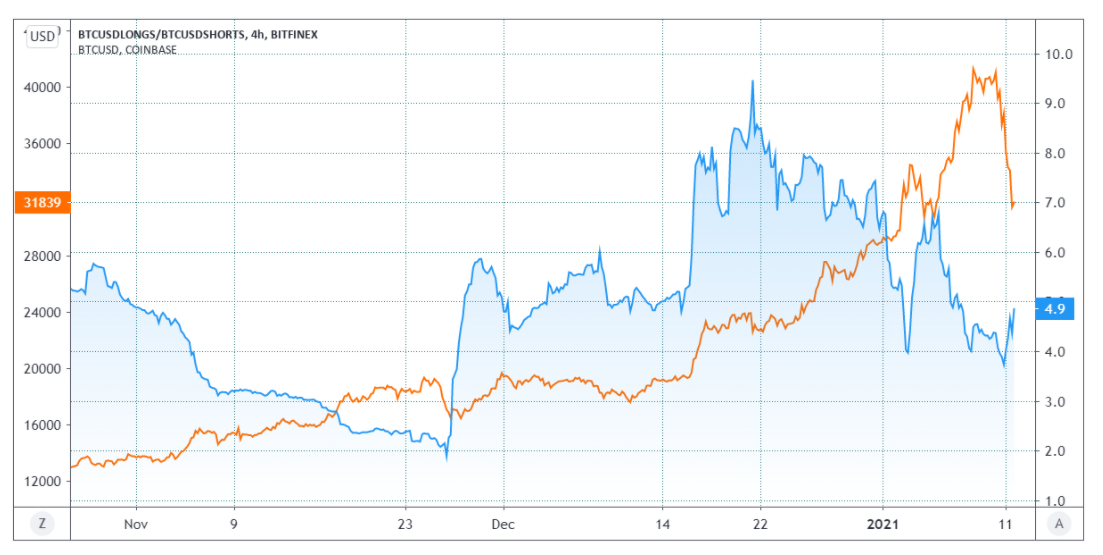
Exchange-provided data shows that Bitfinex’s long-to-short ratio increased from 2 to 9, favoring longs between Nov. 25 and Dec. 21.
To put things in perspective, its 6-month moving average stands at 6, leaning toward longs. Thus, considering its leverage data from margin products, these traders have been surprisingly profitable.
20% of crashes are the norm rather than exception
It’s also important to consider that Bitcoin holds a 3.75% daily average volatility. Therefore, these large corrections should be expected.
Bitcoin faced a 50% intraday decline on Mar. 12, 2020, yet for those patient enough to hold through those bearish periods, an 11x rally followed as the cryptocurrency hiked from $3,600 to almost $42,000.
The views and opinions expressed here are solely those of the author and do not necessarily reflect the views of Cointelegraph. Every investment and trading move involves risk. You should conduct your own research when making a decision.