In my fifth journal entry, I provide updates on my previous Bitcoin (BTC) position, highlight a new BTC position, and discuss a recent altcoin trade on Ankr Network (ANKR).
BTC/USD
Setting up the trade
Entries: $7,940, $7,900
Targets: $8,395, $8,949, $9,723
Stop loss: I set the stop loss at $7,834 which is below the ascending channel support with a bit of breathing room to avoid a long wick or shake out. I eventually moved it down to $7,797 before moving it again to $7,878. I will also provide a deeper discussion of why I moved the stop numerous times.
Risk / reward: Target 1 = 4.38, Target 2 = 9.7 Target 3 = 17.16 based on first entry at $7,940
Entry idea
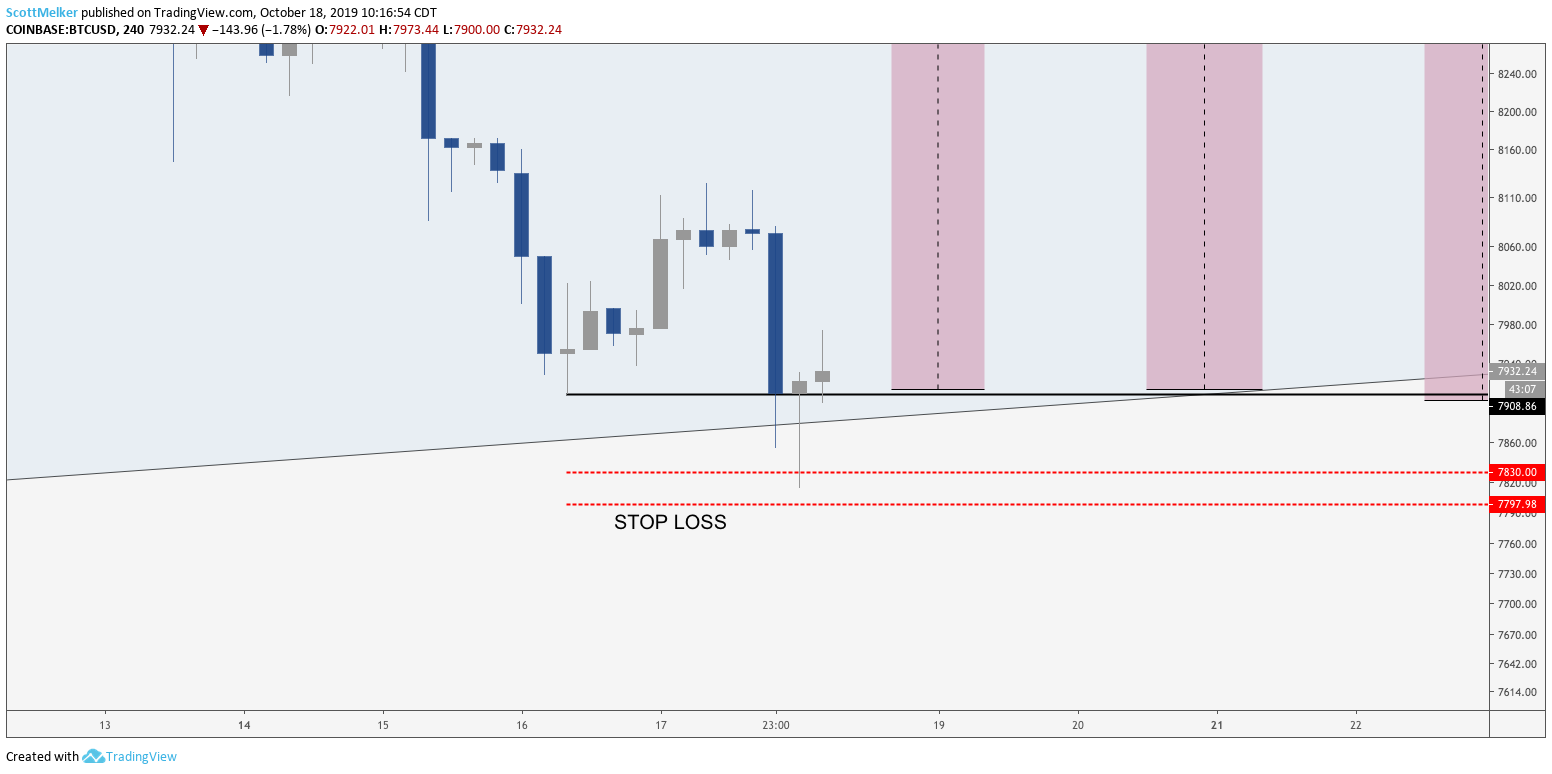
The chart for my original set up is included below. For reference, I wrote up the entire trade in the journal entry. The basic reasoning for the trade was the clear hidden bullish divergence with the relative strength index (RSI) and the bounce off of the bottom of the ascending channel. The risk to reward for a long position also satisfied all my conditions to enter a trade at the time.
BTC USD 4-hour chart. Source: TradingView
This trade went my way initially but reversed rather quickly. I posted the idea on twitter and one of my followers pointed out that, in his opinion, my stop loss was set a bit too tight. I considered his opinion, recalculated, and based on my position size, was still well within my calculated risk to move my stop loss down slightly.
I moved the stop to $7,797 and as shown below, I was quite lucky with this decision. Price wicked down below my initial stop loss before reversing to re-enter the ascending channel. Instead of being stopped out, I doubled my long position at $7,900.
BTC USD 4-hour chart. Source: TradingView
The price began to form a clear descending wedge on smaller time frames, a pattern that is statistically likely to break to the upside. This further convinced me that Bitcoin was likely to bounce from the bottom of the ascending channel.
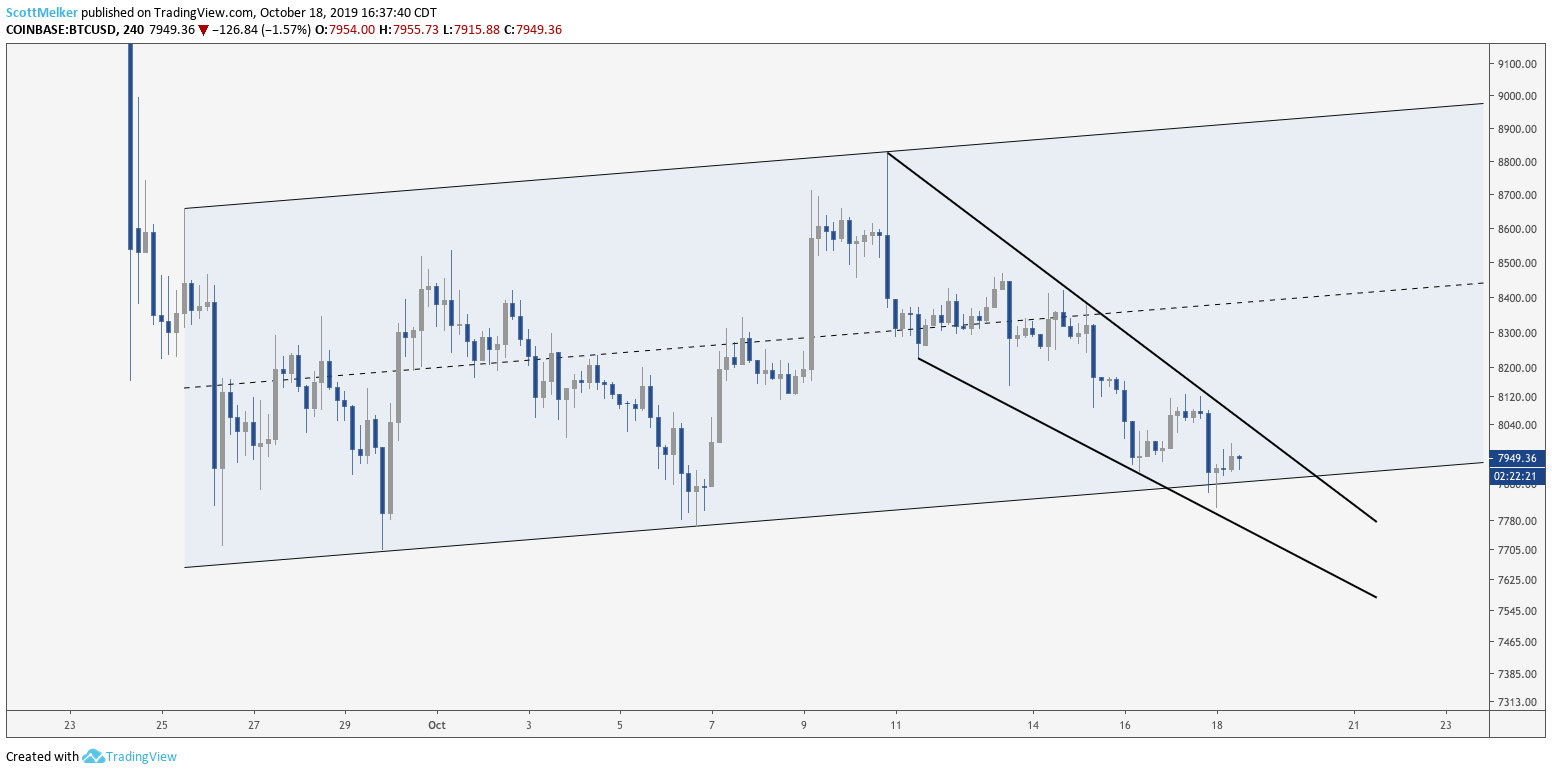
BTC USD 4-hour chart. Source: TradingView
Bitcoin bounced nicely and made a move towards the first target, the equilibrium (EQ) of the ascending channel. However, the price stalled below the EQ, and on a final push up to $8,350 created a long wick and an ugly candle. This is shown as the last candle on the chart below. At this point, I exited half of the position at $8,200.
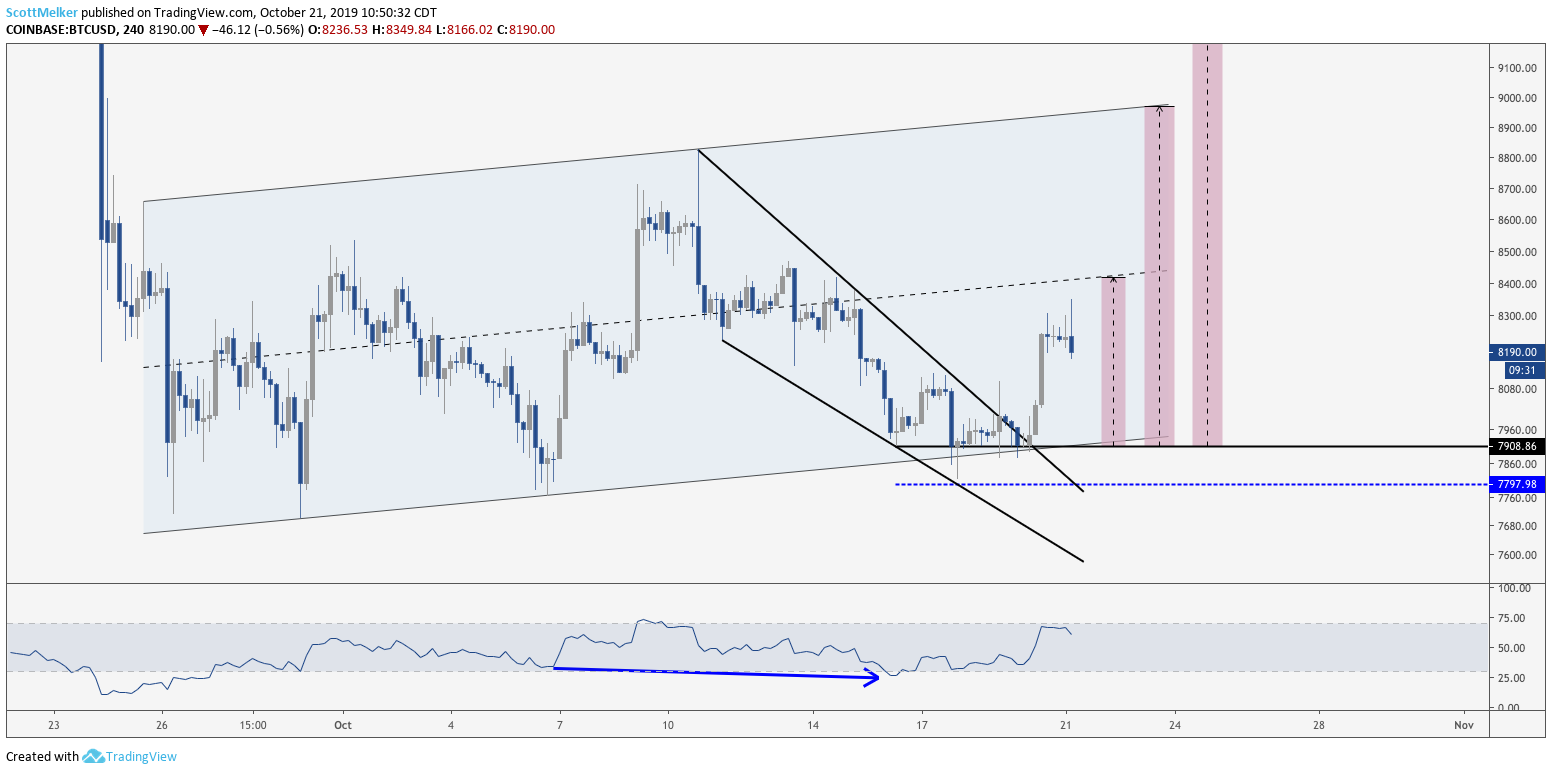
BTC USD 4-hour chart. Source: TradingView
The remainder of the position I held but moved my stop up to reflect the rising price and ascending support of the channel. Pictured below are the stop losses that I moved. I finally settled at $7,878 for the stop, which is where the remaining 50% of my position closed at a loss. In retrospect, I should have been far more aggressive with my stop, moving it into profit.
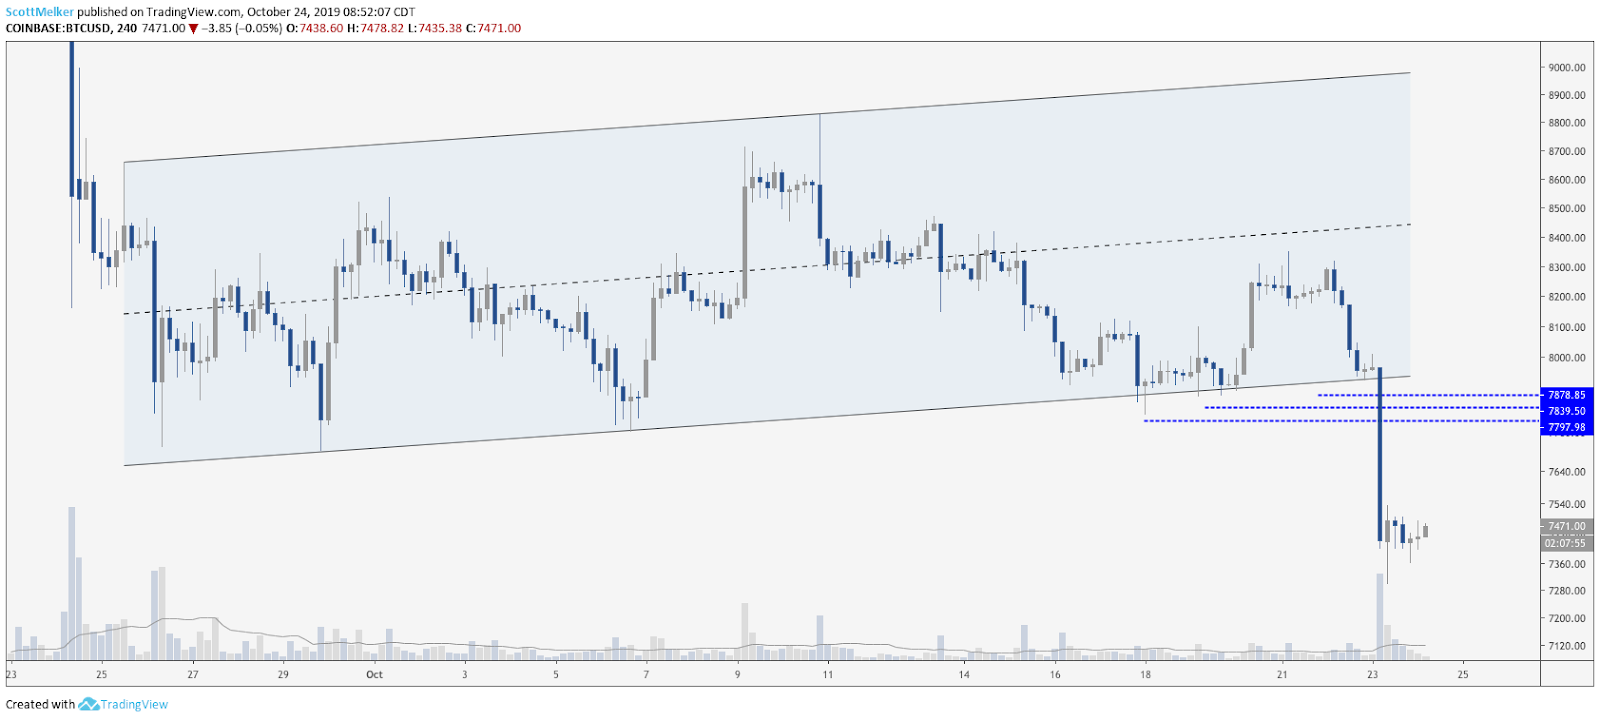
BTC USD 4-hour chart. Source: TradingView
How it worked out
3.2% gain on the first half of the position ($7,940 – $8200). 0.27% loss on the back half of the position ($7,900 – $7,878).
Part 2: Setting up my new Bitcoin trade
Entry: $7,390
After a significant break down from the bear flag on Oct. 23, Bitcoin price approached a buy order that I had set in June 2019. There was no rational reason for me to remove this order as doing so would be an emotional decision based on the recent drop. I filled my bids at $7,390 in the highlighted zone below.
This also amounted to an almost perfect 61.8% retrace of the entire move from the $3,100 bottom to the $13,800 top, considered by many to be an ideal entry. I consider this a long term position that I am building and used money from my sideline USD (I keep 15% of my crypto portfolio in dollars for investing on the dips), not from my trading account. That said, I presently have orders lower in case of further depreciation and have not set targets or a stop loss.
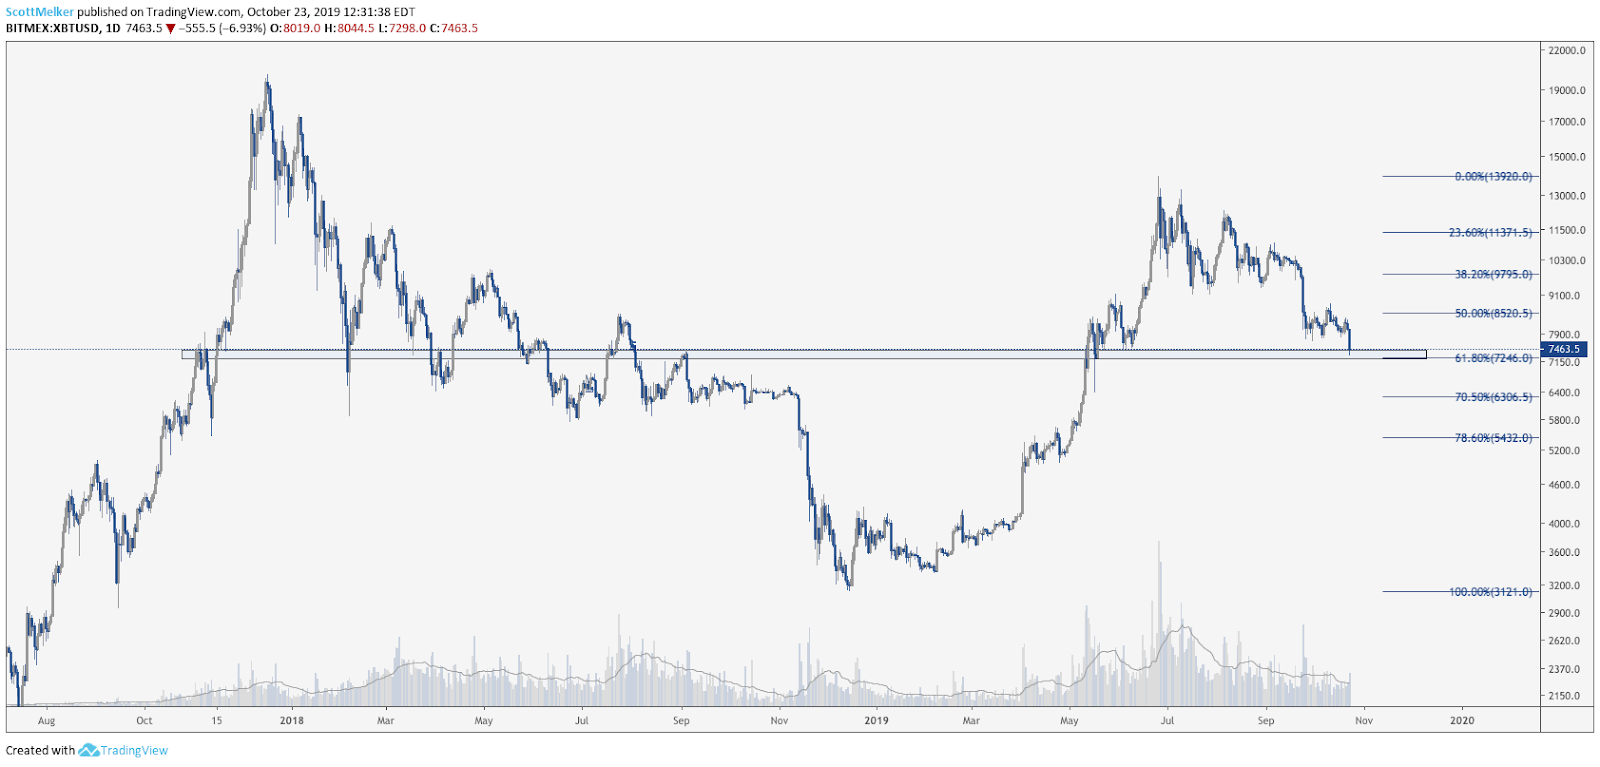
XBT USD daily chart. Source: TradingView
Further, Bitcoin was flashing a bullish divergence on every time frame ranging from the 4-hour to the 3-day time frame. These divergences have now been confirmed from all time frames below the 12-hour chart. I am still awaiting confirmation of a bullish divergence on the daily time frame.
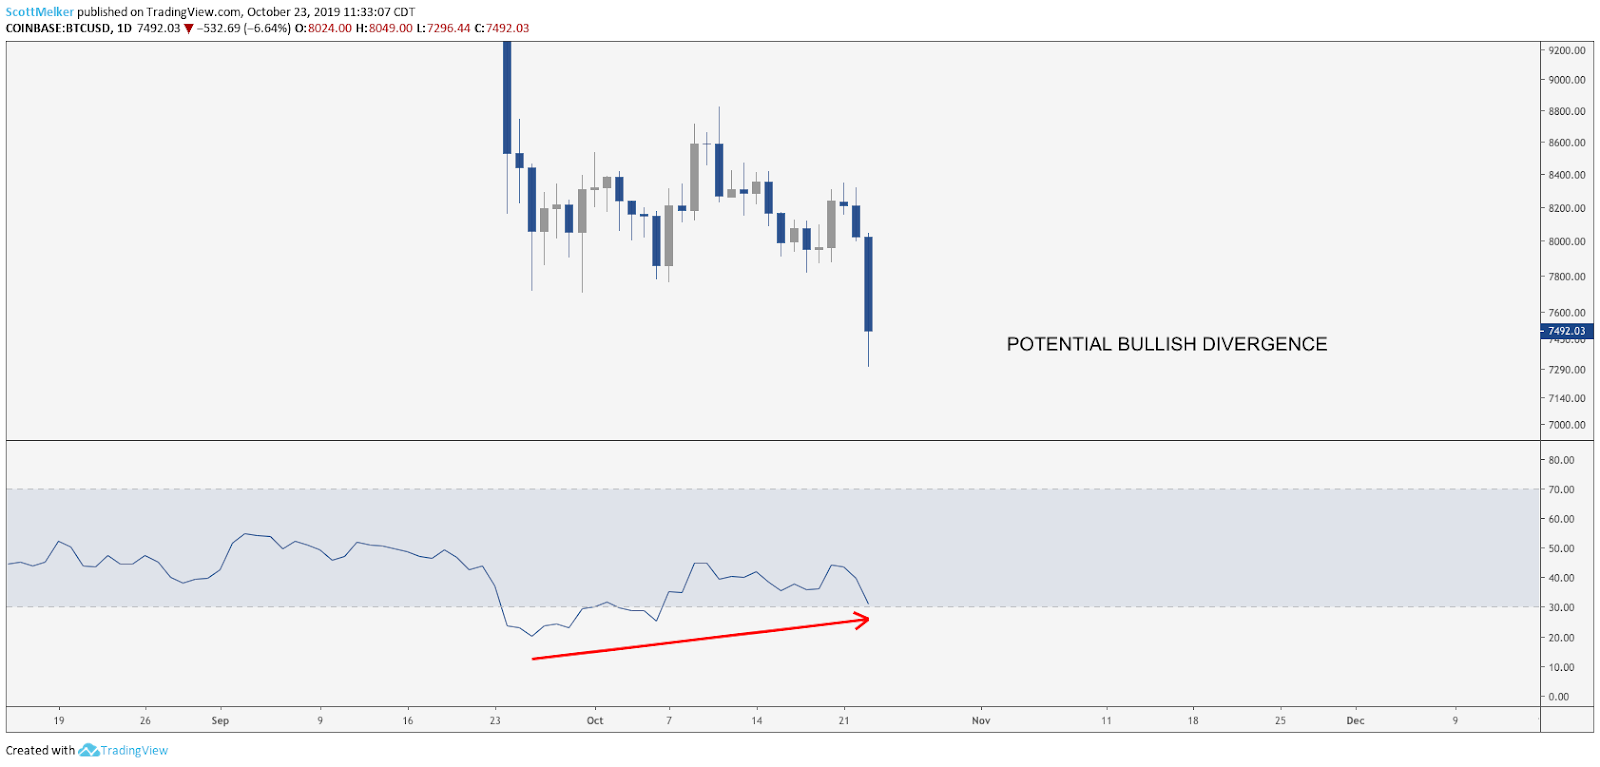
BTC USD daily chart. Source: TradingView
ANKR/BTC
Setting up the trade
Entry: .00000025 satoshis (sats)
Targets: .00000035 (sats), .00000040 (sats), .00000048 (sats), .00000061 (sats)
Stop loss: .00000022 (sats) for a potential loss of 12% on the position. This would be a 1% trading portfolio loss.
Entry idea
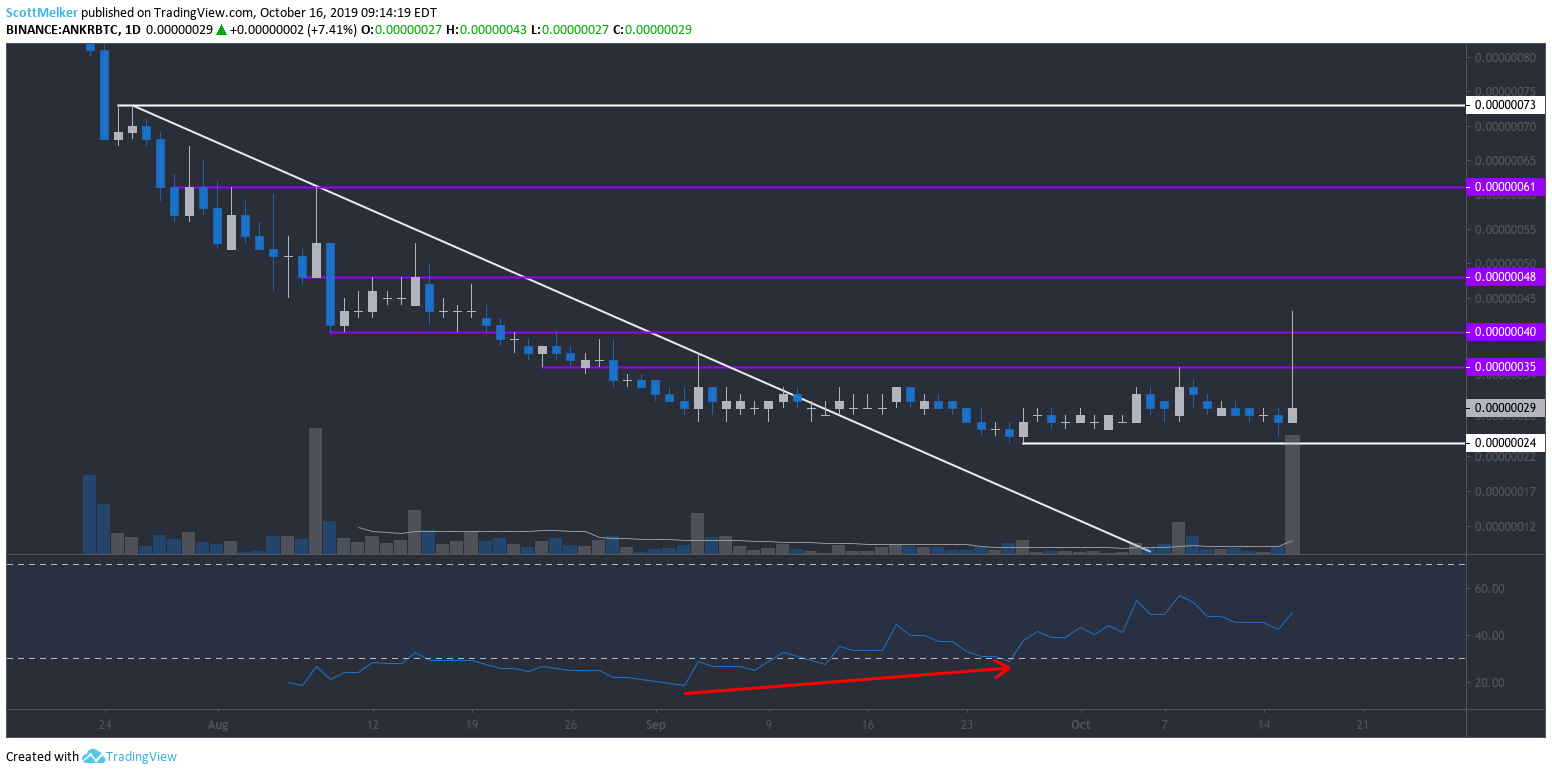
I set alarms on Ankr Network (ANKR) for a potential break of the major descending resistance shown on the chart below. My idea was to enter on a retest of this line. I was not watching when the retest occurred but I saw a potential bullish divergence forming on the RSI.
This divergence was confirmed on Sept. 26, so I entered the trade at .00000025 sats. I immediately set a stop loss at .00000022 sats to provide a bit of breathing room below the recent low where the divergence was confirmed. I set take profit targets at the purple lines shown below.
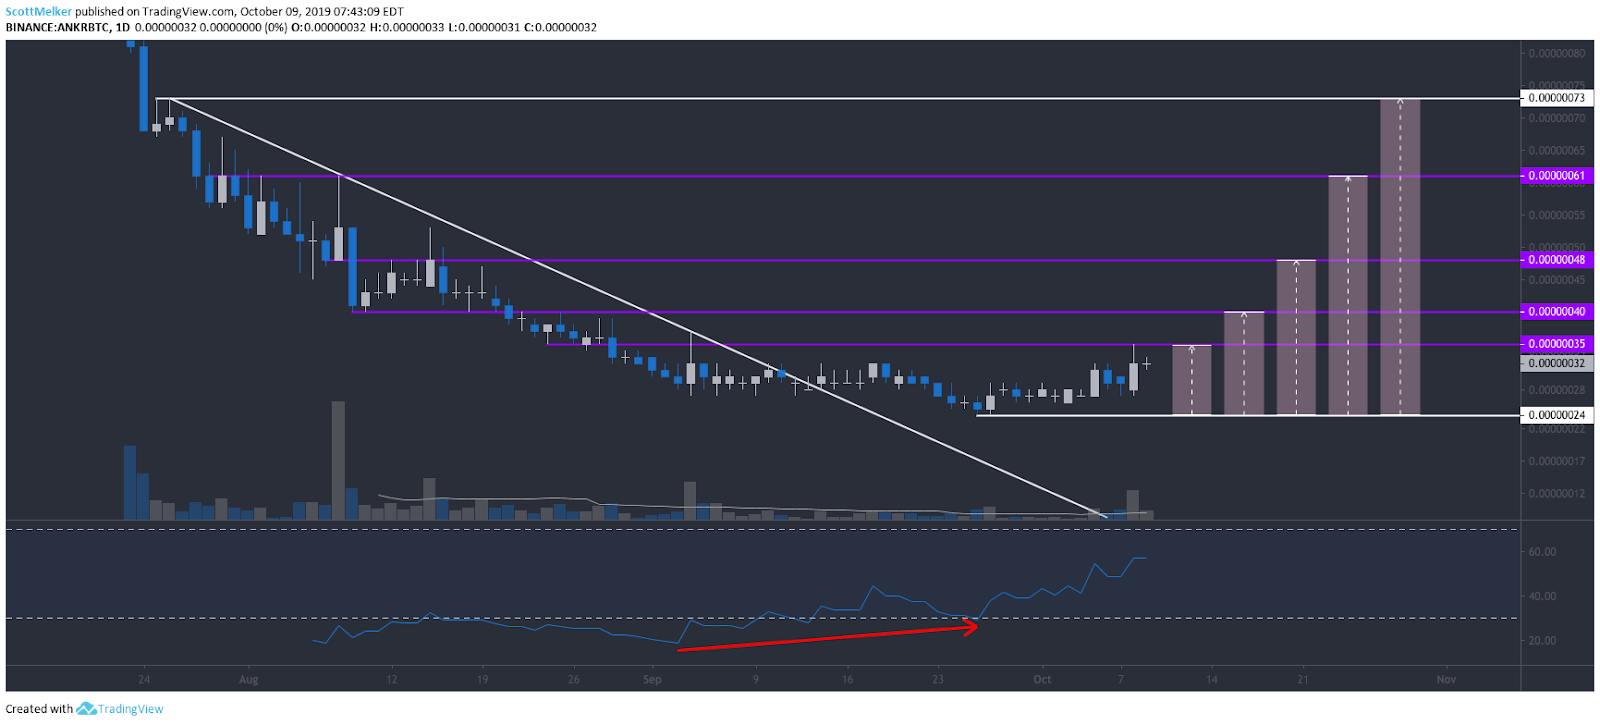
ANKR BTC daily chart. Source: TradingView
How it worked out
I’m very happy that I set my take profit orders in advance. This coin was pumped and subsequently dumped within a day but my sell orders were filled for 70% of the position. I sold 35% at .00000035 sats and 35% at .00000040 sats. These were 40% and 60% gains. My stop is still set at .00000022 sats for the remaining 30% of the position.
ANKR BTC daily chart. Source: TradingView
The views and opinions expressed here are solely those of the (@scottmelker) and do not necessarily reflect the views of Cointelegraph. Every investment and trading move involves risk. You should conduct your own research when making a decision.